|
Introduction
Music venues are hubs for the like-minded to collectively engage in culture consumption. Live music performances create a special bond between the performers and their fans yet it is the music venues that provide a platform for the performers and an aesthetic experience for the audience. When conducting a study of these music consumption centres, we acknowledge that the demand cities have for music venues act as a feature of mobilizing cultural values, by providing hospitality in a business of experience management (Lugosi, 2014). Such terms have been found upon exploration to solidify the use and awareness of music venues and the contribution they have to the individual and societal identity of a city. In this background post, we will be categorizing our analysis in 3 themes, to help build our overall rationale; what can the spatial clustering of music venues in downtown Toronto tell us about the ways in which musical consumption contributes to a city's cultural values. There are the economic relationship between venue owners and and the commerce of their businesses, the marketing relationship between cultural producers and consumers, and lastly the relationship between a venues niche and the industry structure of their business. Literature Review Empirically, music has found its way into sociological research as a feature of cultural capital, that expresses the cultural values of a city and can enhance the diversity, richness and complexity of a region. To support our macro analytic approach to studying music venues, we found the best way to direct our research was within the three themes we proposed to be valuable features of a music venue's ability to produce, and reproduce culture. Hypothesis 1: City Makes a Stronger Effort to Scrutinize and Preserve Music Venues That Bring Cultural Production, Fostering Clustering in Historic District This theme is about the nuances from the laws and regulations that venue owners must balance whilst upholding their niche to their own standards. Music venues contribute heavily to the atmosphere of nightlife, and the city must ensure that these populated events are following policy guidelines to ensure the safety of cultural consumption. In an examination of live music venues in Fortitude Valley, Brisbane AU, Carah et al (2021), they evaluate the ways in which music venues have pushed and pulled between their niche-interests and business interests as a music venue before they find a precinct that is most profitable to them as venue owners, shareholders, performers and party goers. Being the nightlife business, your audience is often varied in their intention, whether it be to drink away their sorrows or celebrate an engagement, the venue owner must think in the interest of their business as well as supplying the experience they promised. The spatial clustering that we analyze further can be seen be supported using the commercialization of spatial clustering music venues from the perspective of preserving their roles as cultural reproducers. Neighbourhoods like Downtown Yonge and Queen West have built a reputation of popular performances legitimized by artists globally enjoyed. Given its historic contribution to cultural consumption, cities have pushed to preserve these economic boosters that reinforce the laws and regulations enforced by surrounding entertainment establishments. The justification for hyper-commercialization lies in the public health concerns of heavy over-consumption, drug use, and other possible safety infringing activities that can occur in those spaces. This highlights how music venues are still in fact business, with a goal of providing a rich experiential opportunity maximizing cultural consumption, but they are not without restrictions and logistics that have macro level effects to its surrounding businesses. Hypothesis 2: Similar type of music venues cluster together to signal and market type of experience provided The business of experience management is made up of practices of hospitality, by providing food, drinks, comfort, and other amenities to ensure that the experience they are providing makes a significant contribution to the cultural value of their niche, and thus the diverse cultural capital of the city. Peter Lugosi deepens our understanding of music venues by seeing them as contributors to mobilizing the cultural values of one's identity and “ how symbolically laden, emotionally charged, immersive, and multi-sensory experiences…can emerge or operate in venues''(pg # 2014). Experiential literature understands the complexity that goes into experience management, where the overall atmosphere they are providing contributes to their success as a business and as a co-creator of the organizer-consumer relationship. In accordance with Lugosi’s argument, venue owners and workers deliberately craft environments that will best benefit their business. To suggest a hypothesis, this could potentially suggest that similar types of music venues (genre, size, venue type) would likely cluster together in certain parts of the city allowing for a large amount of people to mobilize towards that atmosphere and less so in the rest of the city. An example could be club style bars clustering together, in which their affordable drink prices, reasonable security, and popular music aesthetic attracts a youthful audience who also populate surrounding and high in number where youth also resides or gathers for other reasons (University or university residences could be an example). Or jazz clubs existing only in downtown to cater to demography in downtown. Hypothesis 3: Small scale music venues tend to cluster in locations where there are old, already established networks Our research sees industry structure as the ways in which the industry of music and its consumption have played a role in the diverse ways venue owners bring life to urban spaces. Another nod to industry structure is the survivability of smaller music venues, in capacity and legitimacy. According to Whiting (2021), Bourdieu would see that small live music scenes achieve an alternative form of intrinsic value to social and cultural capital, more intimate and recognizable than larger music venues. Besides policy enforcing and business running, building social capital is at the heart of the value of music venues. Amazingly it is these smaller-niche spaces that inspire new ideas that eventually get stolen, exploited and replatformed for the use of gentrification. Ultimately it is hard to quantify the intrinsic value of music, yet the business of experience management and the music industry converge at music venues. This brings a question to the venue owner of who they chose to cater to, their niche or the business market. Where some show interest in the performer themselves promoting an aesthetic experience for cultural producers (performers) and cultural consumers (audience). Beyond the music, the geographical location and aesthetic atmosphere it offers contributes significantly to the growth of the city's cultural awareness as well as feeding the economic prosperity of its neighbourhood. Performing the urban space refers to the ways in which a city is physically used to stage concerts and create musical pathways; "redeveloping refers to the role of live music in the making and regeneration of space, and narrating focuses on live music as part of the stories told about cities" strengthen the relationship between music venue hub within a particular location and the urban city planning. The article that Arnovan der Hoeven wrote suggests a fact of performing urban space concerns the ways in which a city is physically used to be. Also, based on the findings of this body of research, there is a notion that formulating strategies, as well as constructing and maintaining spaces for live music, requires strong networks inside the live music industry as well as linkages to networks outside of the music business. Conclusion + Future Direction As a place of live cultural production and instant consumption, music venues are of great interest to us. Being a production and consumption place at the same time, music venues have to accommodate creative process & people, create a memorable guest experience while making a profit and prospering in the future. As cultural city researchers, the complex nature of the music venues, extensive scholarly discussion, and their changing nature drew our interest. We believe that we have only scratched the surface of how music venues have become one of the major representations of a city’s cultural capital. We do identify some holes and limitations in the findings and theories of the literature that we have reviewed. For example, although we are inspired by the idea of the close connection between experience management and music venues’ success, we do not see much analysis on the social consequences that are induced by the clustering of music venues in Toronto. We are eager to provide some constructive suggestions on how to improve the number of music venues in less “culturally active” regions. Moving forward, we are planning to bring more concrete definitions between different venue types by using Kronenburg’s (2012) classification and plan to incorporate schedule, size, genre, as further data to draw better conclusions and draw insight. Lastly, it is worthy to explore further on what factors contribute to the clustering of music venues in certain areas. Works Cited
0 Comments
Introduction: In Canada, Toronto is the country’s hub in embracing the world's diversity as we are the hub for multiculturalism. We have endless cultures and cuisines which make us such a unique country in the world with a strong melting pot of different cultures coming together. With all these cultural backgrounds, comes different types of restaurants that people can explore. In our spatial analysis blog post we discovered that restaurants clustering within downtown Toronto have the most Steakhouses, Italian, and Canadian cuisine spatially located in that location and this is due to a variety of reasons, one of which being that all of these restaurants were listed as the most expensive. Outside of the downtown core, we were also able to spot a pattern with cheaper restaurants being spatially located together, this included Chinese, Korean, and Mexican cuisine. It is evident through these findings that restaurants could be clustering together or not, with our background research we were able to list four possible hypothesis to explain this phenomenon such as; all restaurants cluster, certain types of restaurants cluster based on location, certain types of restaurants cluster based on restaurant orientation, and lastly certain restaurants cluster based on specific constructions. Through our background research we were able to delve into further reasoning of why restaurants cluster in certain locations in the GTA whilst focusing on our two main theories, central place and cluster theory to explain the clustering effects of our cheaper and expensive restaurants. Hypothesis 1: All restaurants cluster All restaurants cluster together regardless of the kind of meals they serve, the price of the meals they serve, and also their location. Restaurants tend to cluster together because it naturally attracts customers, and they could also keep an eye on each other. The location of a restaurant, its availability, and its accessibility to its customers is imperative to the success or failure of the business. According to Thomas et al. (2010), proximity enables traded and untraded dependencies, including an ability to collaborate, support, and learn from one another. With restaurants, restaurants tend to cluster together because I believe they closely monitor each other to learn a variety of things. “The Junction provides an environment for the exchange of ideas and information for the exchange of ideas and information and helps to mitigate risk. When galleries cluster together, they promote one another, share resources, and draw in audiences who want to make a day of visiting galleries in a particular neighborhood. Galleries often work together, coordinating openings and developing resources such as neighborhood maps” (Leslie and Black 2020:81). The article supports this hypothesis by explaining that stores cluster together because it comes with advantages to both the businesses and the customers. The main advantage mentioned is that clustering attracts more audience and customers. Regarding restaurants, customers have multiple choices when restaurants are clustered together. For example, malls have a food court where customers have a variety of options to choose from especially when they’re unsure. This also helps to decrease research costs. Another example would be that a good number of restaurants are located downtown Toronto because most tourists tend to stay downtown during their stay. This would increase the possibility of new customers because the restaurants are clustered downtown. “The ‘buzz’ associated with creative clusters offers a multitude of job opportunities, mitigating some of the risks associated with short-term, freelance and project-based work.” (Leslie and Black 2020:75) this supports our hypothesis that regardless of space or location a restaurant will be in a place that offers a space with a lot of job opportunities for individuals. Hand in hand this supports our cluster theory that establishments in these regions and districts offer advantages like employment offerings which advances these types of restaurants that cluster together regardless of price or location, these restaurants that merge and cluster will be cohesive together. Hypothesis 2: Certain types of restaurant cluster amongst each other depending on the location Location selection for upper scaled and pricer restaurants is based on location, which is why internal agglomeration which is the clustering of similar type of firms or restaurants within key locations (Jung and Jang: 2019) .It is a key factor for the success and distribution of these types of restaurants clustering together. Our hypothesis is supported by the work of Jung and Jang (2019), who explain the idea behind central place theory in terms of why expensive tend to cluster together, and this is based on external agglomeration which is greater due to the fact that consumers transportation time and cost would be reduced with these types of establishments being clustered in central business districts and hubs filled with people like downtown core. A key point is that distance is an important thing to consider for consumers, so it is found that people consumer and travel farther if a product is expensive and important, and this the case for expensive restaurants when they are are similar and clustered together spatially it would logically make sense for a consumerist perspective why this would work and this would in turn reduce search costs for customers, if many similar type of restaurants are cluster together with similar price ranges, images, and concepts this would target a specific audience and group of people to travel to a central place to have options in consuming this. Jung and Jang (2019), further explain the clustering of expensive restaurants with agglomeration theory which is the the endogenous externality reasoning for restaurants th”at are expensive clustering and the the benefits are cost structure so many types of similar based restaurants can exist near each other, keeping the same level of competition, and performance as well as supply benefits such as better access to skilled labor which in turn helps the image of the these restaurants being clustered and increasing both heightened demand for these type of restaurants and reduced search costs. An example in the journal article is the idea of placed based associations, “Because place-based associations are inseparable from the products sold there emotions are created and reinforced by experiencing the place where consumption occurs finding that luxury retail flagship clothing stores agglomerate in urban areas to generate a high-quality perception of the location also supports this notion” (Jung and Jang 2019: 449), so when a consumer travels downtown to specific districts and areas that offer similar types of restaurants this showcases a placed based association where a consumer would know where to come back for the same type of clustered businesses. Very similar to the idea of bar hopping, where many bars would be close together in walking distance from one another, they cluster together for a purpose and it shows that higher level of differentiation of businesses show poorer performance in Jung and Jang (2019) research so expensive restaurants clustered in downtown supports this notion. On the other hand for lower priced restaurants they are likely to cluster closer to consumers and where they live than higher priced restaurants because the cost of consuming food at a lower priced place will increase more if the location moves farther away from consumers (Jung and Jang 2019:450), the point is in comparison that you need time to travel downtown so there’s a reason higher priced point restaurants cluster there. Since demand is fixed and uneven in terms of space and location, lower priced restaurants tend to not cluster within one region so there’s a reason why you can find cheaper restaurants sporadically spaced out, “Based on this difference in perception by price, many high priced firms tend to locate within the central business district, while a large number of low price and price sensitive firms tend to locate outside the central business district and closer to where customers live” (Jung and Jang 2019: 450). Hypothesis 3: Certain types of restaurants cluster amongst each other depending on the restaurant orientations (marketability) Location is one of the elements that any restaurant needs to focus on, it determines if the restaurant will be more profitable and exposed. Through spatial coding we found that many restaurants are actually concentrated in close proximity to each other. This may stem from the fact that some restaurants choose their locations with more geographical advantages in mind, such as population threshold and accessibility.Based on Smith (1985), he classified restaurants into five categories: pizza parlors, fast food restaurants, regular restaurants, doughnut stores, ice cream, and frozen dessert stores. He argues that restaurant location choices have an underlying business logic and are not just based on the elements of greater population or accessibility, and that to truly understand location patterns requires an explanation of the relevance of intra-city retailing (Smith: 1985). Smith (1985) used official restaurant maps to analyze restaurants in several large and small cities in Toronto. He found that pizzerias, ice cream and doughnut stores were more likely to show a diffusion trend, while fast food restaurants and regular restaurants showed a clustering trend. Pizza, fast food and ice cream are more often located on busy streets, while regular restaurants do not rely on busy streets, which means that the location choice of regular restaurants is not directly related to traffic. Pizza parlors are strongly associated with residential areas, but ice cream is usually located in shopping centers. Regular restaurants are more numerous in large cities, fast food and pizza are more numerous in small cities, and regular restaurants dominate in central business districts (Smith: 1985). This illustrates the fact that each type of restaurant has its own logic of location choice, for example, people in residential areas may choose to eat close to their pizza or fast food restaurant for convenience, while people who want to eat out, i.e., those who choose regular restaurants, will be willing to go further away. On the one hand, the same type of restaurant is dispersed because it is more competitive in the region. On the other hand, the clustering of restaurants of the same type may reduce the research costs for consumers (Zhang et al.: 2021). According to our spatial coding map, higher-priced restaurants (regular restaurants) are concentrated in the downtown area, while some lower priced restaurants are more dispersed. This is consistent with the results tested by Smith (1985), which implies that many restaurants of the same type are actually clustered in one area. This may be due to the fact that downtown areas are more densely populated and people are more likely to eat out, giving the more expensive restaurants an advantage. The lower priced restaurants usually offer semi-prepared or simple meals, and people are more likely to eat closer to them. At the same time, downtown, the busiest part of the GTA (the central business district), may have the spending power to support the higher prices (Smith: 1985). Certain types of restaurants cluster amongst each other depending on the food type. High-priced restaurants are concentrated in economically prosperous and more populous areas, while affordable restaurants may be concentrated in residential areas or shopping centers elsewhere, thus reducing people's search costs and travel distances and increasing convenience. This supports the idea of marketability of a restaurant. For any business owner whether they are in the food industry or art industry, financial gain is one of the most important aspects to keep their business running and sustain a steady income. Clusters of restaurants are likely to form because business owners view strategic location selection as an opportunity for economic growth. Some reasons that clusters may succeed are because of critical mass, rising tides and perfect audience (Patterson and Silver 2015). Food clusters are comparable to art districts because of how they are set up geographically. Small and large businesses that provide similar goods are located near one another creating clusters or “art scenes” (Patterson and Silver 2015). An article titled “The Place of Art” discusses the success of art districts in Canada and provides an insight on theories why districts or clusters lead to success. Three of these theories can be related to food clusters. The first theory is critical mass, which suggests that arts growth will develop in art districts (Patterson and Silver 2015). This concept can be applied to food business growing and gaining customers when they are in a cluster or plaza that is heavily populated with other successful restaurants. The cluster of restaurants are creating a prime spot for consumers who are looking for food, and will naturally grow in popularity and economically. The second theory is rising tide, which suggests that art growth will move alongside and at the same rate as general economic growth (Patterson and Silver 2015). Rising tides can also be the reason that many restaurants choose to locate in cities with rapid overall economic growth. Toronto being a perfect example of rapid economic growth because of its large population and tourist attraction. Downtown Toronto is a condensed representation of the entire city. Elements such as cultural diversity, entertainment, and new infrastructure contribute to Downtown Toronto's economic Growth. It is not a coincidence that many of the restaurants that we mapped happened to be located Downtown. Restaurant owners clearly believe in the value of rising tides and naturally cluster in areas that evidently are financially rewarding. The third theory is called perfect audience, which suggests that arts growth will thrive in locations that are populated with a demographic that are likely to consume those types of goods (Patterson and Silver 2015). This theory is definitely a concept that applies to food clusters. Examples of restaurants strategically locating to target a certain audience, are the ethnic restaurants that are located in chinatown, little Italy, little Portugal etc. the idea behind these clusters is that customers of those backgrounds are likely to go to these neighborhoods to find local food and businesses that remind them of home or where their friends and family are from. Other examples that don’t relate to ethnic cuisine are how higher end restaurants and steakhouses are located in areas near luxury shopping malls/streets, hotels, and tourist attractions downtown. These restaurants are often consumed by customers who are celebrating a special occasion or the upper class. It would make the most sense for restaurant owners to scan the population that is regularly present in the area of which they plan to establish their business. This would help them to understand and compare where they would make the most profit based on how well their restaurant fits into the environment. The three theories that the author used to explain the growth of art are the same reasons that restaurants in the food industry are growing as well. All three theories support the hypothesis that restaurant clusters and selective locating occur, and will continue to occur for a better financial outcome for business owners. Hypothesis 4: Certain restaurants cluster based on specific constructions According to Zhang’s (2015) findings on ethnicity, specific restaurants in Toronto cluster based on the location’s ethnic landscapes. Canada is known for its multiculturalism which is seen in cities such as Toronto. Many immigrants across the world come to Toronto to start a new life and the best way to express themselves is through their cultural practices and preservation of heritage, through restaurants their unique types of cuisine that their culture has to offer is shared. Zhang focuses on four locations in Toronto which are Corso Italia, East Chinatown, Gerrard India Bazaar, and Pacific Mall. These are examples of specific ethnic landscapes that attract the attention of businesses and consumers which are seen in our own individual mapping research. When looking at our spatial analysis regarding our map of cheapest restaurants, a good number of restaurants clustered amongst each other specific to their type of ethnic landscape. “The construction and reconstruction of retail landscapes reflects the needs, values, cultural identities, social norms and interactions of ethnic entrepreneurs with the business environment” (Zhang 2015: 678). Many of our “Chinese” labeled restaurants were based in East Chinatown and Pacific mall. A big reason for that is because of what these locations are broadly known for. When you go to East Chinatown, you will see some structural designs that try to replicate the “vision” of China. “People from different cultures have modified Canadian urban landscapes to express their identities” (Zhang 2015: 678). When customers are interested in tasting “authentic” Chinese cuisines these landscapes are what comes to people’s minds in the first place. They want to encounter and feel that authentic experience in relation to food and culture. Because of this reason, more and more businesses relocate to these areas, hence the clustering of certain types of restaurants based on ethnic landscapes. You can also notice the clustering of restaurants in the map of expensive restaurants that involve the districts of Corso Italia and Gerrard India Bazaar that support this hypothesis. All these restaurants are prime examples of making use of a location's ethnic landscape to cluster specific types of establishments in those areas. Limitations: The main limitation of our research is that the restaurants we found are based solely on reviews and rating and the subjective experiences from consumers on the food evaluation websites such as Yelp. This can cause bias, meaning that these restaurants are not objectively rated, which may lead to errors in the selection of these restaurants and cannot completely represent the topic we want to study fairly. There may be more variables that promote people, making reviews and evaluating restaurants by their own experiences, for example, the culture backgrounds of people and the different personal tastes. At the same time, some possible malicious comments and peer competitions are able to negatively affect our judgment and result in misinformation. There are certain instances where individuals are leaving reviews solely on one experience rather than multiple experiences which clouds their judgment on the restaurant. Due to the subjectivity of our methodology it is hard to operationalize what constitutes a high or low rated review and what makes a restaurant expensive or cheap. Secondly, the assessment of price is subjective and changes within the market. When we focus on the menu of the restaurants, expensive restaurants have trial meals, and even cheaper ones have one or two relatively expensive dishes. The judgment of price is ambiguous and biased, which means that it is hard to satisfy everyone’s price perception. There are endless food items on a restaurant's menu and depending on the success/ failure of a business, that could influence the prices enforced on their meals. Conclusion: In conclusion, our group wanted to dive deeper and analyze why restaurants exist in specific locations. There are many restaurants located across all of Toronto and these restaurants have different price points that could be considered either cheap or expensive. After looking at our research, we were able to form four formidable hypothesis to support our theories of central place and clustering to explain the various reasons that cheap and expensive restaurants cluster in the GTA. Although all four hypothesis were strong reasons for clustering, in our research we found that hypothesis three had the strongest explanation of clustering in the city. Marketability is an important factor that businesses take into consideration when caring for their restaurant. Restaurant owners always look for the success of their business and in return of that, they will follow the market flow and account for the trends that best increase their output. Clustering is an important factor in the restaurant market and is a viable reason for the cost output of certain restaurants pertaining to the “cheap vs expensive” price standpoint. References: Jung, S. S., Jang, S. S. 2019. To cluster or not to cluster?: Understanding geographic clustering by restaurant segment. International Journal of Hospitality Management, 77, 448-457. Leslie, D., & Black, S. 2020. Creativity as locality: the role of artists and galleries in a Toronto creative district. In Handbook on the Geographies of Creativity. Edward Elgar Publishing. Patterson, M., & Silver, D. 2015. “The place of art: Local area characteristics and arts growth in Canada, 20012011. Poetics 51, 69-87. Smith, S. L. 1985. Location patterns of urban restaurants. Annals of Tourism Research, 12(4), 581-602. Zhang, CZ. 2015.Construction and reconstruction of ethnicity in retail landscapes: case studies in the Toronto area. Journal of Urban Design 20(5): 677697 Zhang, H., Zhou, X., Tang, G., Xiong, L., & Dong, K. (2021). Mining spatial patterns of food culture in China using restaurant POI data. Transactions in GIS, 25(2), 579-601. Submitted By: Humaira Bangee, Chukwusomebi Danokeke, Nimo Osman, Kevin Turingan, and Jiajun Xia INTRODUCTION In our research, we selected and decoded two of the most famous and diverse cities in Canada, Toronto, and Vancouver. These two cities make up a majority of Asian-style restaurants like Japanese, Chinese, Thai and Korean. With the popularity of Asian restaurants, our team divides Asian restaurants in the two cities into chain restaurants and individual restaurants in the downtown area for comparison and analysis. While we define the difference between chain restaurants and individual restaurants, we can also highlight the comprehensive and diversity of Asian cultures in Canadian society. Through the questions we have framed for Asian chains and individual restaurants in both regions, we are exploring how these chains and individual restaurants separate each other through their operations and services. Under the two contrasting types and models of restaurants, we have described their different operations including many influences and changing factors, such as food presentation, menu, price, and rating. Therefore, we developed three different concerns to sustain our thinking about chain and individual restaurants in Asia: how individual restaurants serve local foods instead of chain restaurants, how price and language are applied to two different modes of restaurant menu and restaurant operations and ratings. In addition, we provide comprehensive background research and its limitations to ensure overall completeness. LITERATURE REVIEW For our three hypotheses, we have done research and selected the articles we feel would be best appropriate to help us with our topics. To help us generate these articles, we made sure to look for articles that connect Sociology to the concept of food and culture. Since our topic primarily focuses on Asian cuisine, we had to find articles that pertained to this topic to make it applicable to our research. Finding articles was not that difficult, meaning that there have been studies conducted similar to what we will be doing. There was one article we found, “Food Studies and Sociology: A Review Focusing on Japan” was a study very similar in which how we will be doing ours pertaining to the idea of Asian food, specifically Japanese cuisine, and apply it to a sociological standpoint. In the authors study, she focused on interdisciplinary concepts such as, food, culture, globalization and the sociology part of it. The author emphasizes on the word “interdisciplinary” because of how all concepts can interact with each other in her findings. The author noticed these common contributions to change among her research, consumers, site locations, and the production of the workers, chefs, etc. (Ceccarini, 2010). Another article we came across in our research, “Restaurant Organizational Forms and Community in the US,” goes into the perspective of restaurant operations, and the way it connects to the location of it. Many social and economic factors are considered when it comes to the food service industries (Carroll, 2011). Understanding the production of culture is something the author took into consideration when conducting their research, which is definitely applicable here has it pertains to sociology. The previous study also mentioned the use of the cultural diamond. We can use these basic concepts of Sociology to help us determine key concepts emerging from our findings. The author of this article made a note about how integral and common a dining experience is part of one’s everyday life, which contributes to social identity and the impact of culture it has (Carroll, 2011). Depending on the country and location the restaurant is located, it can either negatively or positively affect the culture of the community it is in and strongly reflects it (Carroll, 2011). Other factors this author took into consideration in their research are demographic instability in fostering chains, income distribution, suburban sprawl and commuter populations (Carroll, 2011). The concepts from both of these articles can be generalized to our future research as a whole, while individualized research are under the respective hypothesis topic and how it applies to the particular theory. HYPOTHESIS 1 - Majority of individual restaurants serve local, ethnic foods based on immigrants living in racialized neighbourhoods and environment. Individual restaurants are in a shared urban space with chain restaurants that are in competition for their differences in food products sold from their menus. One of the differences that separates individual restaurants from chain restaurants is the quality and originality of foods that independent businesses advertise their foods on their menus. From the reading, “Discriminating Palates: Evaluation and Ethnoracial Inequality in American Fine Dining”, the authors described Americanized fine dining as organized by racialized hierarchies that serves localized foods within a multicultural, densely populated neighbourhood such as a Thai cuisine understood as “Ethnic/Other” (Gualtieri 2021:4). Furthermore, in relation to Americanized fine dining, ethnic restaurants are restaurants that serve cuisines with non-white immigrants such as Chinese people dining in Chinese restaurants situated within multicultural and populous neighbourhood in Chinatown (Gualtieri 2021:14). This is because ethnic restaurants are focused on the cultural meanings behind a localized and racialized cuisine from American diners who are influenced by experiences at inexpensive take-out restaurants that serve stereotyped, American versions of a dish without using special, homemade ingredients and recipes such as pad thai with traditional peanut butter and fusion restaurants, two or more restaurants that share one’s culture based on their experiences with home cooking and ethnic similarities with food ingredients in a dish such as a buffet serving Japanese, Chinese, Korean, and Thai foods (Gualtieri 2021:18). In addition, ethnic restaurants are settled into a lower position of symbolic value within the Michelin star system which they are devalued while Americanized restaurants are assessed in relation to standardized institutions of American fine dining (Gualtieri 2021:22). Therefore, individual restaurants advertise localized and ethnic food products to customers living in pedestrian-friendly environments, highly educated populations, wealthy populations, racially diverse neighbourhoods and tourist areas (Andris and Liang 2022:585) through their dining environment with entertainment options such as music and televisions that immerses the customer into the restaurant’s culture and history (Andris and Liang 2022:588). HYPOTHESIS 2 - More popular, individual restaurants get lower ratings than similar (chain) restaurants When restaurants become popular, waiting time for guests increases and service quality decreases since the guests give low ratings (Keller et al., 2020). Some independent restaurants are not as well known as chain restaurants, so when people choose independent restaurants, Yelp scores plays a decisive factor for customers' choice (Keller et al., 2020). For independent restaurants, choosing the right service to improve Yelp scores is very important to improve customer flow. Although the criteria used by customers to rate restaurants on Yelp: service, food quality, overall service quality, etc., are all important measurement factors, these criteria are not equally important (Keller et al., 2020). 1-3 star(s) reviews pay more attention to the quality of service. Words like "waiter" and time related words are often used in reviews with low scores, and the negative impact of service on guests may make guests ignore food quality in the process of dining. 4-5 stars reviews focus more on a great dining experience, which includes excellent, delicious foods with reasonable, affordable prices, and positive descriptions of the service staff's work. Independent restaurants that want to improve their Yelp scores should first focus on reservation systems to reduce wait times instead of focusing on food quality. In addition to the above factors affecting the rating of restaurants, the per capita consumption of different restaurants (marked by $) also affects the rating of different contents (Keller et al., 2020). Comments, like ratings, are public and affect the overall rating of a restaurant. Restaurants with the lowest per capita (one $) were more likely to receive ratings only about the food ($$ / $$$). Restaurants with the average per capita ($$ / $$$) were more likely to receive ratings from customers about the dining experience. So we presume that on Yelp, independent restaurants will have lower overall ratings than similar chains. The reason for the low rating of independent restaurants is that we noticed that there was a "our story" page on the restaurant's web page. After studying the text in this section, we find that most independent restaurants are started by family businesses. The chefs and waiters in a restaurant are family members. As a result, in order to reduce operating costs, family-owned independent restaurants need to hire as few staff as possible and use family members to serve guests. The number of service staff is not proportional to the number of customers in the restaurant, and the serving time is longer than that in a chain restaurant. This is because independent restaurants do not have a relative supply chain like chain restaurants as the supply of independent restaurants is mostly contacted by the owner and the supplier alone. This means that there is a high probability that a customer's order will quickly sell out or become unavailable. For the guests, these deficiencies will be classified as the factor of service quality, which will lead to the guests' evaluation of 1-3 stars on the platform. HYPOTHESIS 3 – Comparing the dish naming and price of Asian chain and individual restaurant’s menu Whether based on a chain or an individual restaurant, the menu is set to reflect the core representation and culture of the restaurant. For example, the Asian restaurants we studied, almost all these restaurants representing Asian countries use their languages or combinations of English sounds equivalent to their languages. For example, a Thai-inspired restaurant, whether Pai as an individual or Thai Express as the chain restaurant, will both put "Pad Thai" directly on the menu as the name of "Pad Thai". On the other hand, the same goes for Japanese sashimi. The word "Sashimi" is derived from the Roman pronunciation of Japan and converted into the English form. Both individual Japanese restaurants and chain Japanese restaurants will put Sashimi directly on the menu of their restaurants. Another aspect is General Tso's chicken in Chinese restaurants. This dish is a traditional Chinese cuisine very popular in North America, both in Chinese chain restaurants and individual restaurants, which highlights Zhen's review of Chinese restaurants. The formation of the name of this type of dish can be "maintaining a Chinese feel, structure, and offering through its Chinese dishes unpretentious sameness." (2104). Therefore, these examples of classic dishes and names of restaurants proves that the menus of Asian restaurants, whether individual or chain, using their traditional language or pronunciation can better represent their culture and identity, as well as the diversity and uniqueness of Asian restaurants located in Toronto and Vancouver. The most important part of the menu is not only the name, but also the price. According to the comprehensive comparison and calculation of the prices of Asian restaurants in Toronto and Vancouver collected by our group, the average price of chain restaurants is between 15 and 30 dollars, while that of individual restaurants is higher, between 50 and 100 dollars. This price comparison seems to prove that a chain restaurant located in the middle of two city centers can offer relatively cheap prices while still reflecting the speed and convenience that chain restaurants represent, while the individual restaurant price still retains their special and superior feeling as the sole representative and restaurant. But pricing is more than symbolic of Asian chains and individual restaurants. According to Cottingham, "Higher input costs [are] particularly food and labor and drove the increase in menu prices" (Cottingham 2022). This suggests that the pricing of Asian chains and individual restaurants in Toronto and Vancouver based on the cost of food and labor is also driving the pricing of restaurant menus. Therefore, the price of chain and individual restaurants is not only determined by their public positioning, but more by how they run the restaurant. Asian individual restaurants often have their own menu specificities, such as innovative/home-made dishes or highly qualified/family chefs, so the ingredients and labor required are more complex. Asian chain restaurants, by contrast, often share the same universal menu and emphasize simplicity and efficient cooking for the sake of convenience and speed. In sum, we hypothesize that both chain and individual restaurants in Asia are trying to highlight the distinctiveness of different dishes by using the language of their own country and culture, but also to reflect the higher or lower price due to the location, cost, and labor of the restaurant. LIMITATIONS There are some limitations that we could come across in the process of our project, and some potholes we have come across in our research. First, a large number of our readings are studies that have taken place in the United States. While Canada and the USA are similar in its culture, the two countries still differ greatly and using the authors' findings in their research in those cities is not applicable to our two Canadian cities. Another pothole discovered during our research is that some of the articles are also a little outdated. The cities have most likely experienced a great deal of change over a number of years. Another limitation we will come across in our research is that when we look at menu ratings on Yelp, since we have not been to every one of these locations, both chain and independent restaurants, we will be basing our research based off other people's reviews and other factors we can see using the web. Something else to consider as a limitation in our research is that between the two cities, we understand that the same currency is applied, Canadian Dollar, the pricing and value of what each restaurant has to consider varies. For example, the cost of living is higher in the city of Vancouver, so therefore rent is possibly higher for restaurant owners which could affect their reasoning of prices. CONCLUSION Our group has researched the meanings behind individual and chain restaurants based on two populous cities in Canada, Toronto and Vancouver where the majority of restaurants serve Asian cuisine including Japanese, Chinese, Thai and Korean. When searching and listing the empirical, theoretical insights, themes and debates from the academic research articles, we have created three hypotheses that assisted in advancing our research with identifying the major differences between individual and chain restaurants. The first hypothesis argued that most individual restaurants have localized and ethnic foods on their menus to their customers living in a multicultural neighbourhood. The second hypothesis argued that individual restaurants that are well-known receive lower ratings than similar, chain restaurants based on an increase in waiting time, decrease in the quality of service such as receiving the wrong order and serving cold or warm tea instead of hot tea from the influx of orders, and a limited number of restaurant staff working as a majority of individual restaurants are family-owned. The third hypothesis argued the differences between the name and price of Asian dishes in individual and chain restaurant’s menu where individual restaurants use their ethnic language when describing their foods and chain restaurants use Americanized, English terminology in their food descriptions onto their menus. Taking these hypotheses into consideration, we agree that there is indirect competition between individual and chain restaurants with noticeable differences in their style of food based on culture and language on food names and descriptions, as well as the menu prices, restaurant operations and ratings that reflect the restaurant’s ethnic background and socio-economic status in society. Reference List
Andris, Clio and Xiaofan Liang. 2022. “Measuring McCities: Landscapes of chain and independent restaurants in the United States.” Urban Analytics and City Science 49 (2): 585-602. Carroll and Torfason. 2011. “Restaurant Organizational Forms and Community in the US in 2005.” City & Community 10 (1):1-24. Ceccarini, Rossella. “Food Studies and Sociology: A Review Focusing on Japan” Graduate Schools of Global Studies 1:1-17. Cottingham, J. 2022. “Costs for Food, Labor Drive Up Menu Prices.” Arkansas Business 39 (31):29–29. Gualtieri, Gillian. 2021. “Discriminating Palates: Evaluation and Ethnoracial Inequality in American Fine Dining.”Social Problems 1-25. Keller, Daniel, and Maria Kostromitina. "Characterizing non-chain restaurants’ Yelp star-ratings: Generalizable findings from a representative sample of Yelp reviews." International Journal of Hospitality Management 86 (2020): 102440. Song, Hanqun, Bich Van Phan, and Jong-Hyeong Kim. "The congruity between social factors and theme of ethnic restaurant: Its impact on customer's perceived authenticity and behavioural intentions." Journal of Hospitality and Tourism Management 40 (2019): 11-20. Zhen, W. 2014. “Eating Chinese: Culture on the Menu in Small Town Canada.” The Journal of Canadian Food Cultures 5 (1):1. COMPLETED BY: RINEY RODAS, MELISSA AKGEZ, TIYA CHEN, VICKY (XUEYING) ZHANG IntroductionOver the last few decades, Canada has experienced a vast increase in immigration from other countries. Approximately half of the visible minority population immigrated between 1981 to 2001 and the subsequent rapid growth of ethnic groups posed a challenge to the host society (Balakrishnan, Gyimah 2003). The lack of economic capital, social capital and other factors, isolated these visible minorities to particular areas and localities. Since "religion is the key to 'cultural reproduction' and ethnic identity of immigrants” (Agarwal, 2008, p.44), religion such as places of worship could increase social capital in the community. Understanding the spatial structures of places of worship allows us to have a deeper understanding of the social behavior of immigrant visible minorities associated with specific religions. Our group focused on exploring the distribution of places of worship for three faiths in Toronto and the Greater Toronto Area (GTA) - Hinduism, Islam and Sikhism. According to our previous spatial analysis, the basic spatial structures of places of worship (1) are two major clusters on the East and West side of the city, (2) have close proximity to the major highways, and (3) places of worship with the same religion tend to present themselves in mini-clusters. In order to help us conceptualize the aforementioned spatial structures, we explored the patterns by using Durkheim's collective conscience theory and other literature reviews to research the reasons why clusters exist the way they do. Moreover, we view religious faith as a commercial good from an economic perspective, and study the spatial concentration of the chosen ethnic communities, we hope to get a better understanding of the hidden reasons behind such aggregation. Our research presents four hypotheses that aim to explore the rationale behind the distinct spatial distribution and clusters of places of worship around Toronto and the GTA. The first hypothesis is that clusters can be predicted by Google Maps reviews and ratings; using Durkheim's understandings of collective effervescence, collective consciousness and the separation of the sacred and the profane, we hypothesise that ratings differ based on closeness to other places of worship from the same faith and proximity to major highways which in turn create mini-clusters of places of worship from the same faith among the larger clusters of all places of worship on the East and West sides of Toronto and in the GTA. Our second hypothesis explores proximity between places of worship in the same locality; closeness could imply shared parking spaces or different levels of collaboration. The third hypothesis presents the idea that spatial residential patterns determine the clusters of places of worship while our fourth hypothesis asserts that religious competition is driven by spatial concentrations. The last two theories are supported by contemporary articles focused on areas of immigrant settlements and the social behaviors of visible minorities. Hypothesis 1 - Google Maps Reviews and Ratings Can Determine Cluster Formation Durkheim made the argument that social facts are external to us, yet they have the power to coerce the individual (Datta & Milbrandt, 2012, pg. 479). Similarly, places of worship are external to us, but they stimulate personal connections and draw patrons in. This explains why many faith-based places of worship are located alongside Highway 7 and Highway 401, two major highways, according to our spatial analysis. The close proximity to the highway may invite attendees due to its accessibility and convenience, whereas navigating inner streets and traffic may discourage people from visiting places of worship. The focus of analysis for our background research is collective consciousness as coined by Durkheim. Collective consciousness is shared beliefs, attitudes, values, and cultural norms that unify a group (Pandey & Gupta, 2007, pg 891). Places of worship symbolize collective effervescence through the way they congregate and perform practices as a shared entity (Datta & Milbrandt, 2012, pg. 510). According to our spatial analysis, there are many religious clusters formed, there are clusters of Hindu Temples, Islamic Mosques, and Sikh Gurdwaras on both the East and West sides. This expresses collective consciousness where those of the same faith and shared belief systems are located near one another. These collective representations of clusters of the same faith-based gatherings follow a similar structure to Durkheim’s concept of collective consciousness and a shared unity. Although there are short distances between each individual place, they all congregate within close proximities, under a faith-based homogeneous grouping. Durkheim would refer to these as collective representations showing ritualistic locational manifestations symbolizing solidarity and a sense of collective power (Datta & Millbrant, 2012, pg. 475, 478). Durkheim’s theory also highlights that collective effervescence sprouts from collective consciousness; places of worship from the same faith choose to proximally collocate in the same area, expressing a sense of society. This creates an essence of a shared collective religious representation as Durkheim would call forming social bondage (Datta & Milbrandt, 2012, pg. 490). Durkheim’s theory further contributes to this in mentioning that locating near one another creates a strong foundation of shared power and a sense of togetherness. Similar to the sacred and the profane, it is the insiders versus the outsiders. Accordingly, we hypothesize that the reviews and ratings on Google Maps can predict the aggregation of places of worship. We illustrate that worship places that have close proximity tend to have similar ratings and those located alongside the major highways would have higher ratings when compared to the ones that navigate inner streets. Hypothesis 2 - Proximity Can Imply Shared Parkings and/or Collaborations According to Agarwal's (2008) findings on the on proximity between different places of worship, the results showed that places of worship in close proximity to one another tend to share parking as one of their main forms of collaboration. We hypothesize that places of worship in close proximity collaborate on parking. The best method we have available to test this theory (within the limits of our study) is to compare the number of ratings as well as the average rating itself for places of worship in close proximity to one another. The reason we decided to use ratings was based on the article, by Engel-Yan and Hollingworth (2013) which emphasized the importance of having the necessary amount of parking for new places of worship to lay their foundation and build in specific areas. Hence, we assume here that a place of worship’s ratings indicate whether or not it has succeeded in its parking requirements. A higher number of ratings could be associated with a frequent stream of visitors for the place of worship which could mean that the particular place also has a capacity to sustain large audiences. With this in mind, we hypothesize three conditions under the larger theme of parkings and places of worship:
The comparison for the two latter hypotheses provide a single conclusion to the low probability of collaboration between the two places of worship near one and another, but the first scenario indicates two possibilities of either low or high collaboration. For this we have to understand whether either place of worship is able to provide the necessary parking space on their own, which means we need to establish the average number of parking spaces per place, as well as the average attendees per place. The former can be done so by examining the “hybrid approach” to the minimum of parking spaces required for places of worship located in the above-mentioned article by Engel-Yan and Hollingworth (2013) where the minimum required parking is the greater of
Also stated by Engel-Yan and Hollingworth (2013), the average size of a place of worship ranges around 1000m2 which have since doubled in the previous 15 years in Toronto so the minimum requirement for an average parking lot would be 10 x 20 = 200 spaces. For our own study we can assume that all the highly rated places are able to meet the bare minimum on their own, but if the average number of attendees surpass this number, then the places would have no choice but to collaborate with its nearest competitor in order to maintain their high rating. We decided that the best method to substantiate this claim would be to substitute it with the number of reviewers for those places of worship on Google Maps. If a majority of those reviews are positive due to the high rating, then this majority must also represent some of the regular attendees as they are the most likely creators of those posts, making them the best substitute available for the average number of attendees. Therefore, if both ratings are high and either one of the ratings exceed 200 in its amount of reviews, then it would only indicate a high possibility of collaboration with one and another, but if the number of reviews is below 200 for both places of worship, then it would only indicate a low possibility of collaboration as both places were able to accommodate their average number of attendees on their own. We derived this method from assuming accessible parking equals a positive review, so an obvious limitation would be that we don’t have full evidence to know what factors contribute to positive review. The accuracy of this method is unclear, which is why we choose the measurements of Engel-Yan and Hollingworth (2013) as the only reasonable measurement. This method also has no influence on the two other conditions that indicate a low probability of collaboration because if the average rating for either place is low, then the number of reviews don’t factor in as it implies that the reviewers are not regular attendees or have since switched locations upon posting their negative review. Hypothesis 3 - Spatial Residential Patterns Determine the Clusters of Places of Worship The individual makes rational and irrational choices on a daily basis, and religious faith can be seen as a rational choice and economic good (Finke & Stark,1988; Stolz, 2010). In order to generate revenue and sustain themselves, these religious institutions have their unique business models and ways of financial operation. According to Bankston (2002), social products such as faith are not the kind of products one can simply pick from stores rather, they generate revenue from the process of social participation. In order to become consumers of faith, one must become the producer "by participating in interactions of belief” (Bankston, 2002, p.322). Individuals are not born with faith and by deciding what they should believe, they first "decide to become members of communities that produce beliefs, then entails becoming part of a social group” (Bankston, 2002, p.317). In the means of becoming a consumer of faith, environmental influences play an important role. Therefore, the location of the religious institutions is strongly related to environmental influences, such as spatial residential patterns of selected minority religions, the social class position, and individual experiences. Since the locations of the places of worship and the spatial residential patterns are strongly interrelated, by examine and understand the residential spatial distribution of Hindu, Islamic, and Sikhs can establish the reason for the formation of the two major clusters of the places of worship on the East and West side of GTA and Toronto area. Place of worship possibly follows the community because the social community provides the perfect audiences for such institutions. Therefore, the formation of concentration of visible minority - Hindu, Islam and Sikhs is the hidden reason for the cluster of the places of worship. Balakrishnan and Gyimah (2003) argued that visible minorities are mostly immigrant groups; they live in a relatively low-income areas due to the lack of economic and social capital, which is possibly caused by the social distance among ethnic groups, and the "lack of official language facility and social networks” (Balakrishnan and Gyimah, 2003, p.2). A research report conducted by Canada's Creeping Economic Apartheid in 2001 indicated that the annual median income for white Canadians and non-whites exist a huge gap: it was $14,507 for non-whites and $20,517 for white Canadians (Galabuzi 2001; Paul 2001, p.3). Accordingly, since the spatial residential patterns of our chosen ethnic minorities, Hinduism, Islamism and Sikhism, are interrelated with the spatial structure of places of worship, we hypothesize that accessibility and affordability are the necessary conditions in relocating people, which determine the clusters of places of worship. To substantiate these claims, we will look at the income level of the visible minorities, the employment rate and compare the average rental fee in every area. The overall social status of our chosen religious minorities would show disadvantages when compared to the white-Canadian, and the average housing of those urban areas where aggregation of places of worship would be lower than places like Downtown Toronto and North York due to the lack of economic capital of these communities. Hypothesis 4 - Religious Competition is Driven by Spatial ConcentrationsIn modern societies, money is the measurement of everything. The success of an individual is measured by one's economic capital, even the general health of one country is measured by numbers, the Gross Domestic Product. Everything in modernity can be seen as a business, even something seems to be intangible - religious faith. Different places of worship compete for members, money, services, attention, and resources. In business, location plays a crucial factor, especially to places like religious institutions, which focus on attracting a specific visitor base. Located in the right area with the right community could possibly maintain the daily revenues, and when places of worship cluster together it beneficially gathers more traffic flows, which can help generate more money, attention and resources. In our spatial analysis, many places of worship associated with the same religion tend to be present as clusters, the aforementioned phenomenon could be explained from an economic perspective. Finke and Stark (1988) argued that "religious economies are like commercial economies (p.42)". Places of worship in modernity are under a free market economy, where religious pluralism would no longer reduce the religious vitality, but rather, it forms the competition and has a positive association with religious participation. The competition between places of worship is "a stimulus for religious growth and not an avenue for its demise” (Frank and Stark, 1988, p.42), where the religious diversity force and encourage the institutions to provide more religious services, such as religious ritual and religious ceremony, as a result, the number of adherents increased. With the increased traffic, more attention and resources, such as government funding, will increase. Therefore, we hypothesize that the spatial concentration of places of worship will not only form a religious competition but also generate more money, attention and resource. This will be examined by studying government funding on religious minorities, compare the religious "products" from the places of worship in different locations, and differentiate the quantity of rating in google map. We expect that since there is an ongoing silent conflict between religious places of worship, in order to be competitive, they would provide more religious ‘goods’. The website pages of those clustered places of worship would have more facilities and services. Another way to test the diversity of provided services is by observing the reviews on Google Maps. For the major clusters, we predict there will be more government funding on the urban area/ethnic groups where aggregation of worship places are located. LimitationOur main limitation associated with this research is the use of ratings and the embedded bias. While the scope of the study favors the use of ratings and reviews, the feedback given by users for places of worship is not the same as those given to more tangible services such as restaurants, places of attraction, stores or personal grooming services. As we had mentioned above, places of worship have evolved into an intangible business yet, the services provided are catered to very specific audiences hence those reviewing these places of worship are biased to the place of worship. This may be because the reviewer is a frequent patron of the institution or because they are involved in the development and growth of the place of worship itself. While it is difficult to eliminate the bias, our goal in the future development of this study is to categorize reviews and use keywords as the codes to create an ‘average review’ for all the places of worship. This would reduce the possibilities of having extremely positive or extremely negative reviews and would allow for fair comparisons of all places of worship under similar conditions. Conclusion The spatial structure of places of worship is determined by its accessibility, social factors and environmental influences. It has a huge impact and reflection on the chosen religious minorities, Hindu, Islam and Sikhs, and also the society as a whole. Since social facts are external to individuals and places of worship could stimulate personal connections and have the need to draw patrons, they mostly cluster alongside the major highway which enhances its accessibility to the ethnic minorities. In other words, clusters can be predicted by Google Maps' larger number of reviews and higher ratings. According to our literature review, parking spaces also have a direct effect on the spatial aggregation of places of worship; therefore, we hypothesize that places of worship in close proximity collaborate on parking. After doing the background research, we also noticed that the spatial pattern of community and the concentration of places of worship are also strongly interrelated. As a result, instead of looking directly into the pattern of aggression of worship places, we examine the crucial factors of why community located in the way they do. We hypothesize that the social statue on the aforementioned ethnic groups tends to show disadvantage when comparing to the white-Canadian and the lack of economic capital also lead to the fact that they tend to relocate in a relatively poorer area, which is the East and West side of the city, also where our major clustered worship places are. Lastly, we see religion as a business, which means they compete with one another, and also cluster to endeavour for more attention and resources. Moving forward in our study, we will collect and analyze data on Google Maps, parking facility information around places of worship, the social status of aforementioned ethic groups, government funding status, and deeper study on the religious “products” provided by the places of worship. ReferencesAgrawal, S. K. (2008). Faith-based Ethnic Residential Communities and Neighbourliness in Canada. Planning Practice and Research, 23(1), 41–56. doi: 10.1080/02697450802076431 Agrawal, S., Barratt, C. (2014). Does Proximity Matter in Promoting Interfaith Dialogue. Int. Migration & Integration 15:567–587. DOI 10.1007/s12134-013-0295-3 Balakrishnan, T. R., & Gyimah, S. (2003). Spatial residential patterns of selected ethnic groups: Significance and policy implications. Canadian Ethnic Studies, 35(1), 111-29. Retrieved from http://myaccess.library.utoronto.ca/login?url=https://search-proquest-com.myaccess.library.utoronto.ca/docview/215637088?accountid=14771 Bankston, C. (2002). Rationality, Choice and the Religious Economy: The Problem of Belief. Review of Religious Research,43(4), 311-325. doi:10.2307/3512001 Datta, R. P., & Milbrandt, T. H. (2014). The Elementary Forms of Religious Life: Discursive Monument, Symbolic Feast. Canadian Journal of Sociology, 39(4). doi: 10.29173/cjs22189. Engel-Yan, J., Hollingworth, B. (2013). Updating Parking Requirements to Address Evolving Place of Worship Trends. Institute of Transportation Engineers. ITE Journal. https://search-proquest-com.myaccess.library.utoronto.ca/docview/1287977942?accountid=14771&pq-origsite=summon Finke, R., & Stark, R. (1988). Religious economies and sacred canopies: Religious mobilization in American cities, 1906. American Sociological Review, 53(1), 41. doi:http://dx.doi.org.myaccess.library.utoronto.ca/10.2307/2095731 Galabuzi, G.-E. (2001). Canada's creeping economic apartheid: the economic segregation and social marginalisation of racialized groups. Toronto: CSJ Foundation for Research and Education. Pandey, A., & Gupta, R. K. (2007). A Perspective of Collective Consciousness of Business Organizations. Journal of Business Ethics, 80(4), 889–898. doi: 10.1007/s10551-007-9475-4. Stolz, J. (2010). A Silent Battle: Theorizing the Effects of Competition between Churches and Secular Institutions. Review of Religious Research, 51(3), 253-276. Retrieved February 11, 2020, from www.jstor.org/stable/20697344 Submitted by: Winnie Cai, Sneha Ragavan, Simran Vedvyas, Frank WuINTRODUCTION
The most foundational element in the development and sustenance of urban tourism is the accommodation industry. Tourism and travels of all kinds have customarily depended on forms of hospitality catered towards the itinerant, and the advent of hotels in the realm of urban tourism has provided substantial leverage to the industries that seek to capitalize off this demand in the urban 21st century. In the absence of proper hotel facilities, even the most richly attractive cities could not have successfully transformed themselves into a booming tourist destination. However, the mere existence of hotels in municipalities is insufficient for the advancement and growth in economy and urban tourism. In fact, it is the strategic locations of accommodation facilities within the city that is considered to be crucial to the industry’s success. As it is famously said, the three most important factors in the success of a hotel are: location, location and location; cities and towns that want to move into the tourism market begin by building hotels and other accommodations right in their centers. The proximity of accommodation facilities to the city’s main attractions, such as shopping and entertainment centers and the cultural resources, is considered by developers as a necessary condition for success (Arvel and Pizam 1977:18). COMPETITION IN THE INDUSTRY Business competition is a critical phenomenon when gauging the methods and techniques organizations employ to differentiate themselves among their counterparts. Within the hotel industry, this means hotels are in direct competition with other hotels in the region. In the case of motels and inns, alternatively, competition would affect other motels and inns. In the hotel industry, a competitive set is a marketing term used to identify a group of hotels, including the various other competitors that a hotel guest is likely to consider as an alternative. The competitive set can be grouped by any type of classifications. In the scope of our study, for example, the hotel type (hotels, motels, and inns) and city determine the competitive set. We focus on three cities – Downtown Toronto, Mississauga, and Kingston. Furthermore, there must be a minimum of three hotels within a specific region for these institutions to qualify as a competitive set among themselves (Wilson-Mah 2015). However, due to the large homogeneity in services and amenities of hotels throughout cities globally, we have been drawn to question the notion of “differentiation” as it concerns competition within the pertinent industry. The offerings of amenities is a primary driver in the popularity of hotels. There are a plethora of variables that influence the value of amenities; value is often assessed on the basis of room type – including size, bedding, air-conditioning, access to Wi-Fi and television, and window view. The quality of the suite is one of the most decisive features in customer selection, although variations in preferences and expectations do exist depending on the client’s length of stay and price points. Next in line would be the availability of recreational facilities, conference halls, meal plans, and accessibility features within the establishment itself – just to name a few. When examining the importance of amenities in the hotel industry, the categorical imperative offers great insight into the motivation behind business owners concerning the various strategies employed in hotel advertisement, presentation and pricing. As stated by Ezra W. Zuckerman in his writing The Categorical Imperative: Securities Analysts and the Illegitimacy Discount, the categorical imperative refers to the demand on business proprietors to fit-in within pre-existing categories for the objects or services they produce within their industry. In other words, their business must conform to recognized types as opposed to deviating from the norms within their niche (Zuckerman 1999:1399). In the context of hotels, these established categories, or “recognized types,” pertain directly to amenities and price range, as it is invariably the selling point for the establishments. TYPES OF HOTELS The degrees in amenities, however, distinguish the various classes of hotels. In our study, we discovered three classes/types of lodgings: hotels, motels, and inns. We observed that establishments that were high-rises with multiple rooms and corridors finely decorated with elaborate designs and adornments are categorized as hotels. In regard to price points, hotels are situated at the top, being relatively costlier than their inexpensive counterparts – the motels and inns. Motels, on the other hand, are establishments that are occasionally family-owned (unlike corporate-owned hotels) and marketed towards motorists, hence the title mo-tel as a combination of both “motor” and “hotel.” Furthermore, motels are comparatively modest in appearance, absent of the various convenient and high-to-moderately lavish amenities included in hotels. They are often located alongside major highways and intersections and are low-rises typically containing only a few floors. Lastly, Inns are quainter and more modest in nature and much less ubiquitous within the cities in focus. They tend to fall between hotels and motels in their price point and tend to omit the star-rating scheme (Wilson-Mah 2015). CLUSTERING OF HOTELS When considering the clustering of hotels within the three cities in our study, the concentration of these facilities in certain regions can also be attributed to the practice of the “categorical imperative”; the offering of amenities must appeal to the intended market, and thus we have noted that hotels are often constructed in close vicinity to one another when the centrepiece of their focus is a cultural hotspot. That is to say, hotels may not necessarily thrive solely off the above-mentioned in-house amenities they offer to their guests. It is fundamentally the services and outdoor amenities/attractions that exist in proximity to the hotels that augment the appeal of these establishments towards potential clients. For example, in surveying the clustered distribution of lodgings along Blue Jays Way in Downtown Toronto, one can surmise that the location of the Scotia Bank Centre, Roy Thomson Hall, tour sites such as the Steam Whistle Brewing, the abundance of restaurants, and most importantly, the CN Tower incentivizes proprietors to set up their businesses in close vicinity to one another irrespective of the similar services they offer. In the same breath, the convenient location of Pearson International Airport, a golf club, and various other attractions in a few kilometres’ vicinity of the cluster of hotels in the Mississauga region serve as a testament to the significance of outdoor institutions and services to the success of hotels. To Zuckerman, the homogeneity among these hotels within the clusters, both in terms of their shared organizational amenities and geographical attractions, would be a central example of the categorical imperative at work. The aforementioned classes of hotels are key categories in the listing of lodgings within the three cities of our study. Categories, to Ezra Zuckerman, are seminal in the development of these establishments because they reproduce the structures of existing institutions and are, as a result, regarded as legitimate for doing so (Zuckerman 1999:1399). For example, hotels are typically identical to other hotels; motels share the same or similar characteristics to other motels; and inns, despite their uniqueness across the market, tend to favour the qualities of simplicity. Zuckerman posits that, “…The answer to the question of ‘Why there is such . . . homogeneity to organizational forms and practices?’…is that organizations that do not meet institutionalized expectations for how they should look, and act are viewed as illegitimate” (Zuckerman 1999:1399). In focus of Zuckerman’s ideas, it can be deduced that accommodation businesses that function outside of the hotel industry, such as condo rentals and Airbnb, do not pose a threat to the hotels. However, in the reading The Effects of Airbnb on Hotel Performance: Evidence from Cities Beyond the United States, a study found that Airbnb has rapidly forced its way into the accommodations industry, disrupting the hotel industry by appealing to customers across various cities across the world (Dogru, Hanks, Mody, Suess, Sirakaya-Turk 2020:2). Airbnb is an online medium through which property owners are able to list rooms or their entire home for accommodation at an inexpensive cost relative to hotels, motels, and inns; however, costs do vary depending on location – as is the case with hotels (Spencer 2019). Although both hotels and Airbnb are contained within the accommodation industry, they hold considerable differences in services and amenities, with the latter being more autonomous, humble in amenities, and, as stated, cheaper. With that being said, Airbnb, being a disruptive technology, has complicated the categorical imperative by offering a new and improved method of accommodation while simultaneously gaining popularity among travellers and tourists. CONCLUSION The location of a hotel is the primary determinant of its success. It also determines the market segment they will be catering to. Travellers visiting a particular region are usually homogenous in their needs when it comes to accommodations, which leads to a lot of hotels within that region providing similar services and amenities. The more hotels there are, the tougher the competition and the higher the prices. The high level of competition also acts as an incentive for hotels to keep observing their customers needs and offer new services, especially if it is not offered by other hotels within their competitive set. Moving forward in our study, we will collect data on the amenities and services provided and the price for the cheapest available room of each hotel and run analyses to understand how and why hotels differentiate. Works Cited Arbel, Avner and Abraham Pizam. 1977. “Some Determinants of Urban Hotel Location: The Tourists Inclinations.” Journal of Travel Research 15(3):18–22. Dogru, Tarik, Lydia Hanks, Makarand Mody, Courtney Suess, and Ercan Sirakaya-Turk. 2020. “The Effects of Airbnb on Hotel Performance: Evidence from Cities Beyond the United States.” Tourism Management 79:104090. Spencer, Elizabeth Helen. 2019. “Hotels Vs. Airbnb: How Much Can You Save?” Money Under 30. Retrieved February 4, 2020 (https://www.moneyunder30.com/hotels-vs-airbnb). Wilson-Mah, Rebecca. n.d. “Chapter 3. Accommodation.” Introduction to Tourism and Hospitality in BC. Retrieved February 11, 2020 (https://ecampusontario.pressbooks.pub/introtourismbc/chapter/chapter-3-accommodation/). Zuckerman, Ezra W. 1999. “The Categorical Imperative: Securities Analysts and the Illegitimacy Discount.” American Journal of Sociology 104(5):1398–1438. Athiyshan, Lazina, & Shubhani Introduction In our previous blog post, we looked at the spatial distribution of breweries in the Greater Toronto Area (GTA). As discussed in the methodology section of the previous blog post, we mapped our cases by location and colour coded them based on their star rating, out of 5 stars. The colour coding scheme was relative to the average of 4.32 we generated using collected data. Cases with an above-average rating shown were using the colour green. At the same time, the below-average counterparts displayed were red. While we expected this process to reveal something fascinating about the spatial distribution of breweries in the GTA, we were a bit disappointed in that regard. Despite the existence of a few possible patterns that might have warranted further investigation in this section of the project (e.g. the cluster of below-average breweries in Toronto's downtown core), we did not observe a definitive visual cue that inspired further exploration on our map. However, engaging in the background research process for this project has resulted in a shift in our thought process. The scholarly articles we are going to be discussing in this project have indicated inventive ways we can understand our spatial distribution. Primarily, we have realized that the apparent absence of definitive patterns in our map may itself be worthy of consideration. Hence, our aim in this project is twofold. Firstly, by utilizing ideas presented in academic literature, we want to examine this absence of patterns. Secondly, we intend to generate empirically testable hypotheses that may shed some light on the results of that examination. Ultimately, after engaging with our literature, we generated two hypotheses that we believe we can test with data available to us. The first hypothesis generated is breweries that provide a more comprehensive online experience will have above average ratings. The second hypothesis is that more popular breweries will have below-average ratings. Hypothesis OneHypothesis 1: Breweries that provide a more comprehensive online experience will have above average ratings. Based on academic literature, we would like to propose that one reason for the absence of dominant patterns in spatial distribution may be due to locations influencing case ratings. To further this position we would like to introduce Ramon Oldenburg and Dennis Brissett's concept of the third place. According to Oldenburg and Brissett (1982), these "third places" are "public places apart from home and work," where people come together for socialization (267-269). Importantly, they argue that these places must be both "accessible to its" patrons and "appropriated by them (Oldenburg and Brissett 1982:270)." These concepts suggest that patrons must feel a sense of familiarity and ownership over their third place. These are some of the attributes of third places that the authors feel are necessary for any place to serve as a third place (Oldenburg and Brissett 1982). However, they argue that since the essence of these places is dynamic, it is impossible to name and explain all their characteristics (Oldenburg and Brissett 1982). For Oldenburg and Brissett, a variety of settings have the potential to become third places (1982), making this a broad conceptualization. Although this inspired us to start thinking about breweries as third places, it made us look for more specific research that could help us characterize breweries. We did not find specific research on breweries in this regard. However, we found literature focusing on establishments that operate in the same realm. A study by Waxman et al. (2007) proved to be of use. Their paper details an exploratory study conducted in 2005 of students enrolled at the Colorado State University, most of whom were studying full-time and living on campus. Of particular interest to us is the finding that these students mostly used establishments that were off-campus, with most of the students frequenting coffee shops and restaurants as their third place (Waxman et al. 2007). Although the authors believe that their sample size is too small for generalized results, the descriptions of the students' preferred third place seem to suit our project (Waxman et al. 2007). According to Waxman et al., these places provided a milieu that was conducive to activities such as "socializing, relaxation, eating and drinking…and doing homework" (Waxman et al. 2007:427). The findings focus on Oldenburg and Brussett's broad conception of third places to coffee shops and restaurants more specifically. However, given that they occupy a similar place in the service industry as breweries, we believe that the related findings may prove useful in our project. The study by Kühn and Bothma (2018) supported our other findings. In this article, the authors surveyed coffee shop customers in South Africa to determine what characteristics lead to customer loyalty. This article helped us formulate our first hypothesis. Kühn and Bothma (2018) found that a memorable dining experience is significant for cultivating customer loyalty. However, creating a memorable experience is a multifaceted affair that is pretty difficult to accomplish (Kühn and Bothma 2018). According to Kühn and Bothma (2018), coffee shops can generate loyal customers by employing a stimulus-organism-response framework (SOR). The stimulus aspect refers to physical cues (anything that arouses one of the five senses). The organism part refers to the change in the cognitive and emotional state of the customers after entering the shop. The response aspect refers to the behaviour of the customer while in the shop (Kühn and Bothma 2018). These authors argue that if a coffee shop customer is presented with good ambiance and friendly staff, their cognitive and emotional states will improve. This setup results in a type of behaviour which leads them to want to stay longer, spend more money and return (approach behaviour) (Kühn and Bothma 2018). For our project we borrowed this S-O-R framework in order to generate our first of two hypotheses. However, we slightly altered it to fit the scope of our project. Mainly, for the stimulus aspect, we will be focusing on visual rather than physical cues. This is because our primary source of data will be websites (more on this in our limitations section). Additionally, for the response aspect, we would like to refer to it as the increased likelihood to give a generous star rating. Therefore, a more comprehensive online experience will be determined by the number of visual aids that can be found on the websites of individual breweries. These visual aids should give potential patrons a sense of their physical space. Hypothesis TwoHypothesis 2: More popular breweries will have below-average ratings. In the process of formulating our second hypothesis we made use of one article that provided us with a lot of useful information. A study by Kovács and Sharkey (2014), observed how publicity and attention is not always positive. In looking at books in particular, they found how awards can negatively affect how the public consumes the literature; while award-winning books have a way of attracting more readers after its initial reception of the prize, they found that the subsequent ratings of these books tended to drop when compared to those that did not win (Kovács and Sharkey 2014). Kovács and Sharkey (2014) proposed two mechanisms behind why this occurs. Firstly, they explain how receiving an award changes how the book is evaluated. This is because in addition to introducing it to a larger audience, it also attracts more diverse audiences, inviting more scrutiny and thus, lower reviews (Kovács and Sharkey 2014). Secondly, winning an award inadvertently boosts the book’s popularity, consequently leading to more negative reviews due to the off-putting status of this new award (Kovács and Sharkey 2014). The same notion of the effect of popularity and negative evaluations can also apply to our investigation of breweries in the GTA. In our spatial analysis, we found a pattern of below-average rated breweries concentrated in the downtown core, which is one of the few discernable patterns on our map. We believe that this could be a result of these breweries being more popular than those outside of this core. Like award-winning books, these breweries will attract larger, more diverse consumers, and thus, lead to a greater number of below-average reviews. In developing a metric for testing this idea we developed our parameters for determining popularity. For the purposes of our project we are operationalizing popularity in terms of number of reviews. Therefore, popularity here is defined as a brewery with more than 300 Google and Yelp reviews. Based on the Kovacs and Sharkey article we theorize that the more popular breweries (i.e. breweries with more than three hundred reviews) will have below average ratings. The number 300 was chosen because in order for an online presence to show up on AdWord Campaign, the store would need to have a minimum of 150 reviews (RevLocal 2018). Since this number allows for the store to come up more, we decided to double it because many places had ratings in the hundreds to thousands. LimitationsWhile researching this blog post, we came across a few limitations. One limitation of the study conducted is how narrowly a comprehensive online experience is defined. For the first hypothesis, the definition of the comprehensive online experience is based on the availability of images of the space, and multimedia aids. This definition can be seen as narrow because the definition only includes a limited amount of items to be considered comprehensive. Another limitation in our study concerns what we are defining as 'popular.' For our second hypothesis, we operationalized 'popular' breweries as ones that have at least 300 reviews online. However, the number of reviews an establishment receives online and popularity is not necessarily correlated. We are assuming that places with more reviews are more popular for the sake of conducting our study; however, this may not be completely accurate. For one, not everyone writes reviews, so they are not reflective of the general public's opinion. Secondly, many people write reviews to solely criticize, which is also not indicative of the business's popularity. Also, doing so relies on the assumption that breweries with no online presence or have no reviews online are not popular with the public, which is not valid. As a result of this, the operational definitions seen can be very subjective and thus prone to bias. The final limitation we found was that there was a lack of research done on breweries themselves concerning customer experience and ratings. Many articles based on coffee shops and restaurants were used in order to support the research and hypotheses. As a result, assumptions are being made that coffee shops, restaurants and breweries share similar characteristics, where customers have relatable experiences. For better understanding, more research should be conducted on breweries in relation to customer service experience and ratings. This would allow for a better understanding of the relationship between breweries and ratings, as findings can be compared and cross-referenced. ConclusionAlthough we entered this research portion of the project with little direction, we are enthused by the way we were able to approach our spatial analysis in inventive ways. Looking at a variety of scholarly journals, we were able to formulate two hypotheses that we think may help explain what we initially believed to be a lack of dominant patterns in our map. Firstly, we hypothesize that breweries that provide a more comprehensive online experience will have above average ratings. In our future projects, we will examine the websites of the breweries we have included in our spatial analysis and determine if the extent of their online presence correlates with their rating. Our second hypothesis focuses on a phenomenon common with popular books, more popular breweries will have below-average ratings. To test this in the future stages, we will look at the number of reviews a brewery has and see if the amount of reviews correlates with their rating. All in all, this is just the beginning; we hope that with future research and examination we can produce a project that fills the empirical gap in the literature about third places and popularity in relation to breweries. Work CitedKovács, Balázs and Sharkey, Amanda. 2014 “The Paradox of Publicity: How Awards Can Negatively Affect the Evaluation of Quality”. Administrative Science Quarterly 59 (1)1–33. https://journals-sagepub-com.myaccess.library.utoronto.ca/doi/full/10.1177/0001839214523602 Kühn, Stefanie, and Mia Bothma. 2018. "The Coffee Shop Dining Experience and Customer Loyalty Intentions: Brewing the Perfect Blend." Management Dynamics 27(4):12-28 http://myaccess.library.utoronto.ca/login?url=https://search.proquest.com/docview/2173861503?accountid=14771 Oldenburg, R., & Brissett, D. (1982). "The third place". Qualitative Sociology, 5(4), 265-284. http://myaccess.library.utoronto.ca/login?url=https://search-proquest-com.myaccess.library.utoronto.ca/docview/61081104?accountid=14771 RevLocal. 2018. “How Many Reviews Does Your Business Actually Need?” Retrieved Feb. 10, 2020 https://www.revlocal.com/blog/reviews/how-many-reviews-does-your-business-actually-need- Waxman, L., Clemons, S., Banning, J., & McKelfresh, D. (2007). The library as place: Providing students with opportunities for socialization, relaxation, and restoration. New Library World, 108(9), 424-434. https://doi-org.myaccess.library.utoronto.ca/10.1108/03074800710823953 By: Zaiyaan Amin, Raagavi Nirmalarajah, Tammy Shen and Kaylen Sinclair
Introduction
The background research for our study of bakeries in Scarborough demonstrates a Middle Eastern cluster of bakeries in Scarborough that we hypothesize creates job opportunities in specialized goods and services as they have a better knowledge of the customers’ preferences and language. In addition, the cluster of the Middle Eastern emphasizes that there aren't necessarily outsider investors or bakeries making decisions that affect these bakeries. However, they are frequented by a group of people that may have a lot in common. Moreover, consumers would most likely shop at the nearest possible place. The proximity of stores creates attractiveness and competition. Research also demonstrates that globalization influences a strong tie between culture and food. Furthermore, the condensing of specialist organizations is important for securing their resources and social validity of their specialist legitimacy. Finally, branding emphasizes the need to pull from a geographic location and specialist organizational identity. Overall, our background research focuses on the clustering of with bakeries with the same national origin based on their understanding of the product itself as specialized or generalized by fitting the a niches need of ethnic identity in cultural enclaves and proximal location. Cultural Enclaves One of the most striking observations discovered from our spatial analysis on bakeries in Scarborough was the cluster of Middle Eastern bakeries (identified in yellow) near the intersection of Lawrence Avenue East and Birchmount Road. All nine Middle Eastern bakeries included in our spatial analysis were located in this particular area of Scarborough. We hypothesize that this finding is due to a high proportion of Middle Eastern residents who live in that vicinity and that is something that may be studied more extensively further on. However, in order to better understand why this cluster exists, it is important to do background research that delves into studies, theories, and concepts that also seek to explain cultural clusters in relation to businesses. Currently, conflicting research exists as to whether or not cultural enclaves are overall beneficial or harmful. This is explored in a study conducted by Andersson and Hammarstedt (2012) that focuses on ethnic enclaves, specifically consisting of Middle Eastern immigrants, in Sweden. Furthermore, they studied the impact of ethnic clusters on self-employment and discovered that that presence of ethnic enclaves increases the propensity for self-employment. They outline three main reasons for this. Firstly, in the Swedish labour market, Middle East immigrants suffer from low earnings and high rates of unemployment (Andersson and Hammarstedt 2012). This encourages many to create businesses in their area and become self-sufficient. Secondly, immigrants in ethnic enclaves provide their co-ethnics with goods and services that Swedish natives aren’t able to provide (Andersson and Hammarstedt 2012). Thirdly, they have a better knowledge of preferences and language of customers who are also from their ethnic groups and this helps lead to a successful business (Andersson and Hammarstedt 2012). We can apply these three principles to our study of the Middle Eastern cluster of bakeries in Scarborough and hypothesize that this cluster exists because it provides Middle Eastern residents with a chance to be self-employed, provides specialized goods and services to other residents that wouldn’t otherwise be accessible to them, and they have a better knowledge of the customers’ preferences and language. A similar study discussed the influx of Yemeni Muslims (Muslims from Yemen) to the United States and the associated increase in Middle Eastern restaurants located in a cultural cluster in Atlantic Avenue, New York known as “Arab New York” (Staub 1981). This article relates with the previous one in that it attempts to outline the ways in which cultural or ethnic clusters are created and the impact that this has on not just the surrounding areas, but within the cultural clusters themselves. Staub (1981) mentions that a benefit to creating Middle Eastern restaurants in this particular cluster is that the restaurant trade allows the Yemenis to control and create their work environment, both for themselves and their customers. We can apply this theory to our own research and hypothesize that this cluster of Middle Eastern bakeries exist in a presumably predominate Middle Eastern neighbourhood because there aren't necessarily outsider investors making decisions that affect these bakeries; rather, they are being created, managed, and frequented by a group of people that may have a lot in common. While these studies are incredibly useful in helping to understand cultural enclaves and the role they play on the spatial distribution of bakeries, there are still a few limitations worth noting. To start with, these studies tend to focus on immigrants and we have no evidence of yet to suggest that residents living in the area of the Middle Eastern bakery cluster are immigrants. Additionally, these studies focus on both Sweden and New York, United States respectively, and so there can be disparities when using these places as guides to understand patterns in Scarborough. For example, Andersson and Hammarstedt (2012) indicate that Middle Eastern immigrants suffer from low earnings and high rates of unemployment; however, this may not necessarily be the case in Scarborough. That being said, these articles still provide us with useful information and background research that will help in continuing our research. Further research could involve comparing this Middle Eastern cultural cluster to other cultural clusters that exist in Scarborough (for example, Chinatown or Greektown) and focusing on reasons why other cultural/ethnic enclaves don’t have as strong of a cluster of their associated national origin-type bakery. In other words, our research could delve further into understanding why there is such a strong cluster of Middle Eastern bakeries by using other cultural enclaves as comparisons. Location Selection Location is one of the critical success factors of any chain restaurant, store, or business. It explains why places have a cluster of restaurants, and others do not. Why some are near roads, major intersections, or popular districts. According to Chen and Tsai in the article Data mining framework based on rough set theory to improve location selection decisions: A case study of a restaurant chain, several fundamental theories explain why places open in specific locations. Selecting optimal locations is crucial for a business to thrive. The first theory that explains location is Central Place Theory by Christaller, which explains that an area should have enough population for a store to be able to earn profits (Chen and Tsai 2016: 198). This theory, therefore, implies that a consumer would most likely shop at the nearest possible place. If a neighbourhood has a bakery in proximity, despite being a better one a few more km away, that neighbourhood is likely to buy from the one nearest to them (Chen and Tsai 2016:198). The second theory is the principle minimum differentiation theory by Hottelling explains clustering. He suggests that when stores are in proximity, it creates attractiveness and competition. This clustering is suitable for businesses such as restaurants due to their being a higher likeliness of consumers going to a particular area and having a choice (Chen and Tsai 2016:198). An Italian restaurant alone on the road might attract a few individuals seeking that sort of food. However, the same restaurant in a food court at the mall might attract more since anyone hungry is drawn to the food court, and even if they had no intention of eating Italian, they might see it and end up eating from there. The article does an empirical study using these theories on 120 branches of restaurants in Taiwan (Chen and Tsai 2016:202). They can test the theories and provide ideas on how to classify the bakeries in our project. Things such as:
The article Food store availability and neighbourhood characteristics in the United States, shows that the location of certain supermarkets is placed due to socioeconomic status, race, and ethnicity. Areas with lower social status or those considered inferior will experience higher fast-food restaurants, mostly the ones associated with causing obesity. They also have higher numbers of small stores such as convenience stores, whereas higher status neighbourhoods have healthier grocery stores. This study uses a marketplace software that contains over 14 million businesses in the United States. This study helps to observe how to conduct a study about the location of stores and the neighbourhoods they are in. This article shows how to associate specific characteristics in these stores with concepts such as high vs. low-status neighbourhoods. By using zip codes, one can determine and separate neighbourhoods and stores in those areas. For example, African American neighbourhoods have 2.3 and 1.8 times as many non- chain supermarkets and grocery stores compared to White urban areas (Powel et al. 2006: 193). This is helpful for bakeries since we can test the location of certain bakeries with the level of economic status of neighbourhoods and the race and ethnicities concentrated. Globalization Fusion According to A. Hashimoto & D. J. Telfer, Canada has some very multicultural cities. Statistics have been given out that Toronto has 62 ethnic groups whose numbers are 10,000 people or more and also has 15 ethnic groups with more than 100,000 people (A. Hashimoto & D. J. Telfer, 2006). It suggested that there is a strong link between culture and food. Canada has branded itself as the nation of immigrants that there is new global cuisines which could be referred to global cuisines and referred to the definition as reported in the US magazine Bon Appetit, ‘call it multicultural, cross- cultural, intercontinental, fusion or world cuisine – it is what’s happening in food today. (A. Hashimoto & D. J. Telfer, 2006). In the book Curried Cultures: Globalization, Food, and South Asia, it states that Globalization leads to a paradoxically persistent questioning of identity among migrants and natives alike. Thus, migrating food practices bridge and buffet bodily conceptions of the self and the other, insinuating themselves into conceptions of home and abroad, this place and that other one, private and public. (K. Ray, T. Srinivas 2012) Relating back to our research, globalization fusion provides us an explanation of why there are many different kinds of bakeries in Scarborough area, as Scarborough are populated with many different races that they all blend together to bring its food to the society as a median of cultural exchange. However, there are also limitation in the reading that its target is too broad which it looks at all kinds of restaurants and organizations throughout Canada. Taken a smaller area in our research may give out more specific results. Specialist and Generalist Bakeries In Carroll and Swaminathan article “Why the Microbrewery Movement? Organizational Dynamics of Resource Partitioning in the U.S Brewing Industry” organizational generalists are a foundation for specialist organizations in terms of scale competition and improving the theoretical development of special organization's products and sociological bases connected to organizational identity. Carroll and Swaminathan first hypothesize that the separation of resources is to avoid a niche and increase concentration which creates an increase in specialist organizations. Carroll and Swaminathan argue that this results in the mortality rates of specialist organizations to fall. However, there are scale advantages for generalist organizations as they have maintained a heterogenous organizational resource environment. Therefore, according to Carroll and Swaminathan’s theory and applying generalist organizations to N/A or Other and specialist organizations to all of the bakeries with a national origin you can see that the generalist stores are more widely spread. Thus, we hypothesize generalist bakeries have the potential of being more evenly spread because of their ability to have a heterogenous organizational resource environment that benefits their ability to maintain resources in areas in parks and by the lake further from the centre of the city. Our research would be beneficial by providing future investigation of whether generalist bakeries do have a heterogenous organization resources centres close to the lake or the park specifically. Another theory Carroll and Swaminathan make is that the division of resources due to niches depends on the organization's identity claims and legitimization of specialist identity claims and social visibility. This theory therefore would explain why bakeries of origins on the map are clustered together with other bakeries of the same origins. This would explain how bakeries of the same origins choose to stay close to each other in order to emphasize the legitimacy of their specialist organization. Carroll and Swaminathan note that the presence of visible and legitimate brewpubs creates a negative normative valuation of contract brewers when many other organizations of both forms are present. Therefore, Carroll and Swaminathan theories on identity and legitimacy would emphasize why the N/A or other bakeries do not have any clustering like the categories with a national origin. Instead N/A or other bakeries according to Carroll and Swaminathan theory spread themselves out evenly in order to avoid a negative normative evaluation of their generalist identity. Overall, Carroll Swaminathan emphasizes how the condensing of specialist organizations is important for securing their resources and social validity of their specialist legitimacy. A limitation of Carroll and Swaminathan’s theorization is that their findings for high desirability of their favourite brands were indistinguishable during a blind taste test (Carroll and Swaminathan 2000: 14). In addition, identity can be tested in Carroll and Swaminathan’s theory of a legitimate specialist organization by having a taste test in order to distinguish if there in fact is a geographically there is a link to customers understanding of specialist. Or if they will not be able to distinguish the difference between generalist and specialist bakeries therefore confirming Carroll and Swaminathan’s findings. Branding On the other hand, Andy Pike’s article on “Geographies of Brand and Branding” geography is connected to the understanding and representation of brands. Pike theorizes that their geographies and their brand to emphasize their geographical origins history and spaces of value and meaning resulting in uneven development. In addition, to this experience of place geographically be related to spaces and places. According to Pikes theory it would be beneficial to study whether the reasoning for clustering of nation origin bakeries with the other bakeries of the same national origin is because of their historical past. The limitations to this article is that it does not provide an understanding of these brands as depending on each other geographically for specialist organization relationally. In addition, Carroll and Swaminathan’s findings demonstrate that there is a tangible aspect to the resource industry meaning that there's only so many places an organization can get different ingredients. Therefore, organizations are more likely to conceal their origins in order to mass produce. In the future it would be beneficial to study whether there are any generalist bakeries that conceal their identity as a specialist bakery and whether this therefore supports the specialist organizations clustering because there is covert generalist bakeries that have the heterogeneous resource structure that allows them to have more locations. Our research will help provide insight in the ways concentration of specialist bakeries validates their legitimate identity as a speciality bakery rather than just their historical reliability therefore allowing bakeries to situate themselves in locations they can brand themselves with and off of in association with legitimate resources. Conclusion Bakeries in Scarborough emphasize a Middle Eastern cluster of bakeries that we hypothesize emphasize job opportunities in specialized goods and services due to their knowledge of the customers’ preferences and language. In addition, there is no threat of outside investors in the decisions of these Middle Eastern because of the social networks of knowledge they have acquired through their frequency of meeting with a group of people they have a lot in common with. Thus, proximity plays a key role in the attractiveness and competition of a location. Therefore, the condensing of specialist organizations emphasizes secure resources and social validity of their specialist identity. Lastly, branding entangles the relative ability of a geographic location and specialist organizational identity. In conclusion, our background research analyzes the clustering of bakeries with the same national origin based in order to understand the bakeries as specialized or generalized organizations to maintain a connection with ethnic reliability and location. References Andersson, L., & Hammarstedt, M. (2012). Ethnic Enclaves, Networks and Self‐Employment among Middle Eastern Immigrants in Sweden. International Migration, 53(6), 27–40. Retrieved from https://onlinelibrary-wiley-com.myaccess.library.utoronto.ca/doi/abs/10.1111/j.1468- 2435.2011.00714.x Atsuko Hashimoto & David J. Telfer (2006) Selling Canadian Culinary Tourism: Branding the Global and the Regional Product, Tourism Geographies, 8:1, 31-55, DOI: 10.1080/14616680500392465 Carroll, Glenn R., and Anand Swaminathan. "Why the Microbrewery Movement? Organizational Dynamics of Resource Partitioning in the U.S. Brewing Industry." American Journal of Sociology 106, no. 3 (2000): 715-62. Accessed February 11, 2020. doi:10.1086/318962. Li-Fei Chen, Chih-Tsung Tsai, Data mining framework based on rough set theory to improve location selection decisions: A case study of a restaurant chain, Tourism Management, Volume 53, 2016, Pages 197-206, https://doi.org/10.1016/j.tourman.2015.10.001. (http://www.sciencedirect.com/science/article/pii/S0261517715300212) Lisa M. Powell, Sandy Slater, Donka Mirtcheva, Yanjun Bao, Frank J. Chaloupka, Food store availability and neighborhood characteristics in the United States, Preventive Medicine, Volume 44, Issue 3, 2007, Pages 189-195, https://doi.org/10.1016/j.ypmed.2006.08.008. Pike, Andy. “Geographies of Brands and Branding.” Progress in Human Geography 33, no. 5 (October 2009): 619–45 Ray, Krishnendu, and Tulasi Srinivas. Curried Cultures: Globalization, Food, and South Asia. University of California Press, 2012. Staub, S. (1981). The Near East Restaurant: A Study of the Spatial Manifestation of the Folklore of Ethnicity. New York Folklore, 7(1). Retrieved from https://search-proquest-com.myaccess.library.utoronto.ca/socabs/docview/1290845722/fulltextPDF/3C9B0D25F3E045FEPQ/2?accountid=14771 By: Tiffany, Julia, Lindsay, Bernardo  The Gladstone hotel is known to be “Toronto Boutique Art Hotel”, where artists design the rooms. The Gladstone hotel is known to be “Toronto Boutique Art Hotel”, where artists design the rooms. Introduction Our last blog, we look at the venues location and realized a few patterns. Now we want to take a closer look or uncover more patterns that will help us conceptualize the live music scene in Toronto, specifically it’s growth and contribution. A good way to do this and improve our understanding is to explore why certain venues exist where they do. As well we aim to uncover the ways location may speak to their significance as a platform for creative artists in the industry. We often hear mainstream artists perform at venues located in the Downtown core like Rogers Center rather than Kensington, and we wanted to examine why and the factors that are at play. To better help us attend our goal, we delved more into significant trends that were being represented in the data points. What we discovered some factors to be localization and agglomeration effect for certain venues in certain areas. Using literary work and background knowledge in reasons why this happens, we looked to literary research to guide us in making sense of these areas of growth and potentially coming to conclusions. Upon doing research, the theories that guided us included; Daniel Silver’s scenescapes and Silver & Patterson’s critical mass as well as rising tides. With these theories in mind, we came up with two hypotheses. Our first one is art growth and specifically live music venues in toronto grow and get established as a result of critical mass and either remain due to an established scene or they migrate to an area that fosters and promotes artistic growth. And our second hypothesis is rising tide and the use of funding to funnel growth in certain areas. This can be influenced by public policies as economic growth is seen in areas with surrounding different amenities such as parks, salons, local bar etc. Hypothesis 1 The blue pins on our map below show that a large concentration of music venues are located in the downtown core. Venues such as the Rogers Centre, The Scotiabank Arena, The Budweiser Stage, Roy Thompson Hall, and The Sony Centre for the Performing Arts are all multipurpose venues that are associated with tourism in Toronto, and they happen to be clustered in the same vicinity. We believe that this is an intentional policy move to help promote music and art in the city, creating a reputation for excellence in musical performances on the world stage. Large venues such as the Rogers Centre and Roy Thompson Hall, host a wide array of different musicians that perform various genres of music from classical, to pop and even reggae; the diversity of the musical genres that are promoted show that venues like the ones mentioned above appeal to the masses. The mass appeal of big venues draws in tourists from all over the world to take part in musical events in Toronto’s downtown core. The rising tide theory, relates well to the idea of using music and arts to attract tourism and consumption in the downtown area, particularly because many of these venues are in close proximity to other prominent tourist attractions like the CN Tower, Eaton’s Centre, The Harbourfront Centre, Centre Island and even the Ripley’s Aquarium, they are able to feed off of the hordes of tourists to gain popularity and traffic. As a city, Toronto is extremely diverse but one thing many Torontonians have in common is a love for music, at any given time, on any given day you will see people on the train, walking down the street or waiting for the bus with headphones on, getting lost in their favourite soundtrack. Music has become an integral part of Toronto’s cultural scene and the city is taking action to ensure that through promoting the creative and cultural economy with musical events and festivals, the city can capitalize on the economic benefits of the flourishing musical scene. The rising tide theory is understood through the implementation of cultural policies and promotion of the arts, particularly in tourist concentrated areas such as the downtown core. Various governmental bodies have shown interest in the income that the music industry can generate for Toronto, and some of the city’s large performance venues are actually publicly owned, such as the Sony Centre for the Arts (Toronto Music Advisory Council, 2016). A report called Live Music Measures Up was commissioned by Music Canada and Nordicity and published by the Toronto Music Advisory Council (2016), shows the huge impact that the music industry has on Toronto’s economic success; live music companies and the tourism sector have added nearly $1.2 billion to Ontario’s GDP through the promotion of music festivals and tourist spending. Although the policies are seen as beneficial to the art scene, the high cost of performing at these major venues is often a deterrent to many small, local artists who do not attract large crowds in comparison to viral or famous artists like Beyoncé or Diplo. Many of these policies can become problematic when they cause rising costs and gentrification pushes local artists to the fringes of the city where rents are lower, and venues are smaller. However, why do areas downtown or in Parkdale receive large amounts of funding and does it have anything to do with public policy? Baird and Scott (2018) “Towards an Ideal Typical Live Music City” outlines how live music is a significant component in developing a city’s creative and cultural economy and Toronto is a great example of this. Live music city is derived from neo-liberal policy setting, in which the policy aims to market the venues as spaces of competition, instead of spaces of exchange (Baird & Scott, 2018). For example, intentionally funding and promoting venues like the Scotia Bank Arena because of the various amenities it has to offer, compared to a venue like the the Opera House which has much more limitations for potential revenue generation, speaks to the purpose of the policies in place.These policies lead artists to be pushed out of the Downtown core and subsequently marginalized, risking cultural sustainability in the musical arts sector. Despite the concerns about cultural sustainability, live music development is still a significant contributor to Toronto’s economy. There is a great amount of revenue coming from it, but as seen with the prevalence of gentrification and the creation of various musical hubs in fringe neighbourhoods around the city, the funds don’t always benefit local contributors to the musical scene in Toronto. In addition to the $700 million in funding mentioned in the Toronto Star, the national music funding body and the city of Toronto created a guide for cities seeking to become a live music city themselves (Toronto Music Advisory Council, 2016). Daniel Silver “The American Scenescape” explains that scenes with strong self-expression promote growth and innovations in the arts (Silver, 2011). According to Silver, scene perspective was created to characterize places as a whole and not only a single item (Silver, 2011). For instance, viewing a neighbourhood from a perspective of recognizing the salons, parks, shops and so on, rather than just seeing it as the place where the local bar is located helps to see it as a community. Areas like Parkdale, Kensington Market and the Downtown core all reap the benefits of the policies that inform the rising tide theory, even though the benefits are experienced unequally across each neighbourhood. Research done by Music Canada outlines how funding certain areas generates tourist development, while at the same time it adds artistic growth and job creation (Toronto Music Advisory Council, 2016). The reasons that certain areas receive city funding while others do not, comes down to economic potential and what types of businesses, attractions, and marketing opportunities exist in that particular neighbourhood. In the case of the Downtown core, the options are (almost) unlimited, and therefore the core often receives the majority of the public economic funding available to musical venues and tourist hot spots. The more big venues or popularity a neighbourhood has, the more public funding they generally receive; but the neighbourhoods that exist on the fringes of the city are beginning to make a name for themselves as local musicians flee the downtown core in search of more affordable and sustainable areas to live and work. Hypothesis 2 One recurring theme for creative innovation tends to surround the importance of location. We can predate this importance back to Richard Florida’s mention of a Bohemian Index that presumes that artistic people will reside in areas of close proximity. Since then, sociologist have explored this notion and have expanded on this theory to make better sense of the agglomeration effects. In Matt Patterson and Daniel Silver’s look into art growth, they note the theory of critical mass as being a possible factor in these clustering effects. Critical mass is the idea that, “art growth occurs not directly within established arts districts, but rather in nearby, less saturated areas” (Patterson & Silver, 2015). From our mapping we realized that this is true, particularly for live music venues as we see a push away from the more centralized, resource filled and wealthy neighbourhoods into developing areas, specifically Parkdale and Kensington. A culturally wealthy neighbourhood like Toronto’s Downtown core has the largest music venues in the city and hosts the widest amount of genres. This includes places like the Scotiabank Arena (previously known as the ACC) and the Rogers Centre, which are well promoted. However due to high rents and lack of good creative space, Toronto Central has pushed out artists to find more available spaces that have higher affordability and availability for space and programs. As noted by Patterson and Silver (2015), Parkdale in the 90’s became the breeding ground for artistic work as it offered not only lower rent but also opportunity in the potential rebranding of the neighbourhood into a “creative district” (Patterson and Silver, 2015). Taking Silver’s idea of critical mass, we can also see a more micro perspective, such as the neighbouring areas around Parkdale. From our mapping, we can see venues such as The Drake Hotel, The Great Hall and the Gladstone Hotel. Looking at the map, these venues are being surrounded by art amenities such as, The Theatre Centre, Toronto Media Arts Centre and Curry’s Artistic Materials, which help contribute to the rise of a self-expressive art scene outside Parkdale. In our analysis we seek to further explore how this happened and how it has also affected Kensington, another developing creative district that may have been influenced by critical mass. Our main argument of how one area results in effects of critical mass stems from another piece by Daniel Silver, about scenescapes. The main theory that Silver brings up is the scene perspective, which is surrounding the idea that scenes are founded around three main defining qualities; theatricality, authenticity and legitimacy (Silver, 2011). These scenes, once qualified, are considered an expressive scenescape. We seek to explore this by examining how Kensington Market has developed since the 90’s to become this known area of artistic growth and musical hub (specifically Jazz). Having had its beginnings as a Jewish Market (McBride, 2014), the area has progressively embraced its validity as a scene. Kensington Market has not only become an over exaggeration of what an creative space is (theatricality) but has remained the city’s staple creative space. Having maintained and conceptualized this identity by the continuation of low rents, fostering programs and festivals (McBride, 2014), it maintains its sense of authenticity as being this vibrant creative milieu. Alongside these government funded events, there are many amenities in Kensington that characterize this local space. For example, the many boutiques, music stores and live-music venues, help towards a more self-expressive environment. Furthermore, Kensington has fought back gentrification (McBride, 2014) to uphold its legitimacy as a creative space. Through these building blocks of creating a scene, we believe that artistic growth and specifically the growth of live music has a founded atmosphere of potential which influences migration from central toronto, out to less wealthy and resource filled neighbourhoods. Lastly as another feature mentioned by Patterson and Silver (2015), critical mass, art growth occurs in or in nearby by art districts Outside of the core Parkdale area, we can see that there are neighbouring areas that help with the self-expressive art scene. Therefore as a last area of research we would like to possibly explore where the next migration might be. To do this, we would have to look at the venues that lie outside our already established location (i.e. Parkdale). This would include:
Overall. our hypothesis is that live music venues and their artistic growth are a direct impact of critical mass and scenescapes working together to influence innovative location and spaces of growth. Conclusion This research has been guided to discover the factors that are at play with venue locations in the city, as well as the funding being given to encourage growth in various neighbourhoods. Both critical mass and rising tide theories are important as they help explore reasons for venues receiving public funding and support, as well as reasons behind the growing popularity of smaller musical scenes like Kensington Market and Parkdale. As large venues and focuses on promoting tourism drives costs higher and higher in the Downtown core, more affordable neighbourhoods seem to reap the benefits by cultivating communities of smaller local artists and creating a “hipster” type of authenticity that promotes the clustering of a multitude of various smaller art forms including small music venue conglomerations. Sources McBride, J. (2014, July 2). For the love of Kensington. Retrieved from Toronto Life: https://torontolife.com/city/kensington-market-toronto/ Patterson, M., & Silver, D. (2015). The place of art: Local area characteristics and arts growth in Canada, 2001–2011. Poetics, 51, 69-87 Silver, D. (2012). The American scenescape: amenities, scenes and the qualities of local life. Cambridge Journal of Regions, Economy and Society, 5(1), 97-114. doi:10.1093/cjres/rsr028 Baird, P., & Scott, M. (2018). Towards an ideal typical live music city. City, Culture and Society,15, 1-6. doi:10.1016/j.ccs.2018.03.003 Live Music Measures Up: An Economic Impact Analysis of Live Music in Ontario. (n.d.). Retrieved from https://musiccanada.com/resources/research/live-music-measures-up/ Silver, D. (2011). The American scenescape: Amenities, scenes and the qualities of local life. Cambridge Journal of Regions, Economy and Society,5(1), 97-114. doi:10.1093/cjres/rsr028 By: Shay, Mel, Deborah and Tiffany IntroductionHair has always been a prevalent form of expression within culture. In fact, hair was seen as a powerful symbol of individualist identity (Soulliere 1997). The versatility of hair allowed for the manipulation of length, texture, style and colour to represent oneself. The occupation of hair stylists facilitated these changes in hair, as they were trained on the ways to cut and style hair. Historically, the role of a barber was incredibly respected, as they were believed to be “spiritual leaders,” and this was supported by the notion that they were often referred to as “barber-surgeons,” because they performed medical procedures along with grooming hair (Ocejo 2017). Today, the hair industry is a $2.5 billion business in the U.S., and continues to show signs of growth (Soulliere 1997). Despite the social importance and business growth of the hair industry, the perception of hairdressers is not positive. It has been viewed as “a simple” occupation that is presumed to be done by unskilled or low-skilled workers. However, these notions do not align with the research on the industry. Literature suggests that stylists engage in complex forms of communication and require a variety of skills, including strong interpersonal and interactive work with clients on a constant basis (Yeadon-Lee 2012). Aside from skill, this occupation also has a level of creativity involved, wherein hairdressers can be expressive through the hair cuts they perform. In fact, a number of hairdressers often refer to their skills as their “craft,” as opposed to a requirement of their occupation (Ocejo 2017). This indicates that there is an element of culture and meaning associated with this occupation and those who engage in it. Gendered Pricing Introduction Our group examined hair salons throughout different locations within and slightly outside of Toronto. One of the hypotheses the group put forth was that gender is a variable that may have an influence on pricing. Literature on gender based pricing suggests that gender itself is in fact a variable that often changes pricing. A case study on hair salons was reviewed and the results indicated that within a unisex hair salon, there are indeed differences in pricing between men and women (Megan et al. 2011). Hair salons justify the higher charge for women haircuts, as a women’s haircut “take longer,” “require more skill,” and “are more detailed.” Research on the topic of gendered pricing show that there are price differences when men and women ask for identical haircuts at unisex hair salons (Megan et al. 2011). Showing there is an underlying sense of pricing discrimination in the hairdressing industry. Thus, the literature lends support to this hypothesis. Background Research Much of the research regarding gendered pricing examines products and services that are identical in nature and yet yield different prices for men and women. Literature out of the U.S and UK examines products that fit this description such as deodorant, which is a product used by both men and women. It also includes services, such as hair cutting and dry cleaning. The concept of gender based pricing is seen by many scholars as price discrimination, with many countries having outlawed the practice (Megan et al. 2011). Price discrimination is defined as “the practice of charging one group different prices than another for identical goods or services-has been shown to exist in different markets on the basis of race, gender, and class” (Megan et al. 2011:2). There are three conditions that have to exist for price discrimination to be able to occur. The first condition consists of the supplier having the ability to split their market into two different sets of buyers. In the case of hair salons, the two groups of buyers are split by gender. The second condition that must exist revolves around differing price elasticity. The last condition that must be met is that the markets must have low price competition. Hair salons are able to successfully charge different prices and capitalize from the two genders by way of price elasticity. This notion is also known as “willingness-to-pay” (Liston-Heyes and Neokleous 2000; Ferrell et al. 2018).According to Liston-Heyes & Neokleous (2000), in a typical market where there is a uniform price, there will be consumers that are willing to pay more than the set price. This is a example of “consumer surplus” which is determined by examining the difference between the price that consumers pay and the price that they are willing to pay. This concept of “willingness-to-pay” is present within pricing in hair salons because these businesses offer services that do not necessarily have uniform pricing (Liston-Heyes & Neokleous 2000). As a result, the owner or supplier retains control over the pricing and determines it as they see fit. Alternatively, in a regular uniform business, the prices can be determined by the market (Liston-Heyes & Neokleous 2000). The literature also speaks to expectations and attitudes regarding gender based pricing discrimination (Ferrell et al. 2018). One study examined the attitudes of individuals who were subject to experiencing gender based pricing discrimination (Ferrell et al. 2018). Men and women were charged differently for a basic haircut and a questionnaire was administered to capture their attitudes regarding this. One finding of the study indicated that the students expected women’s haircuts to require more time to complete, as well as more skill (Ferrell et al. 2018). Another key finding indicated that attitudes regarding gender based pricing discrimination can differ based on the service it is being charged for (Ferrell et al. 2018). This is largely reflective of the attitude the women put forth while they were charged more than men for their haircuts. Due to their expectation that this service would cost more for women, they did not dispute the price difference (Ferrell et al. 2018). We want to be careful with the statement, the point here is that both men and women confront to the notion of gender in pricing difference. This may be a result of true differences in the services, but could also be caused by cultural stereotypes about women (Ferrell et al. 2018). This raises the concept of consumer surplus once again, wherein women are expected and willing to pay more than market price for some services. This surplus could be caused by cultural expectations and norms created around the services provided for women. Our current study hypothesizes that gender based pricing discrimination is a pricing strategy that is adopted by the hair industry. This will be examined through studying how pricing operates within hair salons. Pricing as a variable will be operationalized as the specific prices of various services at these hair salons and how they differ for men and women. This information will be obtained through the pricing list offered by each hair salon. This would subsequently be coded and analyzed to reveal any patterns that may be occurring. BrandingIntroduction Traditionally, becoming a hairdresser as an occupation was not viewed as a desirable occupation (Ocejo 2017). Popular myths suggested that jobs in the industry lacked security and had lower income when compared to members of similar education in different occupations, namely, college graduates (Ocejo 2017). However, those drawn to the industry choose to pursue it because of their passion for the service, not necessarily for financial rewards. As such, this notion of lack of security and lower income did not discourage those who entered the field for creative reasons. Through the perspective of stylists, their job is viewed as a calling (Ocejo 2017). Given the creative nature of hair styling, pricing mechanisms adopted by hair salons should be explained with a non-linear pricing model like the one depicted in Karpik and Scott’s (2010) book about valuing creativity. This model states that slight shifts in the quality of products will cause a significant change in the cost. In the case of hair salons, the quality is perceived by the customer by way of hair cut. The quality is also signified to the customer by aspects of the salon itself, such as design and mission statement. In essence, a portion of how clients perceive salons and potentially their quality, is through how the salons brand themselves. Background Research Literature suggests, there has been a shift in the hair industry, with the jobs being rebranded as “cool” and “creative,” with the chance for workers to influence tastes and create new things (Ocejo 2017). In their perspective, these jobs are callings and serve to provide them meaning in what they do. In today’s knowledge-based economy, “people’s ability to be creative and innovative make them the most valuable commodity in the market,” (Ocejo 2017:16). As such, this ability to be creative and express this through one’s work is highly regarded. Moreover, professions such as hairstylists or barbers involve a skill set that is unique to the service industry. These individuals must engage with customers on a daily basis and engage in forms of emotional labour through this (Ocejo 2017). However, there is an aspect of meaning that is derived from these professions and the individuals under study suggested that they pursued work that provided this meaning for them (Ocejo 2017). Our study hypothesizes that changes in branding can have an influence on the pricing within these hair salons. This literature will be examined to explore if this may be the case. Factors within branding that will be examined are physical, cultural and creative. Literature suggests hair salons and barber shops incorporate visibly different aesthetic styles. In the case study of the barbershop, Freemans, there is a notable theme which adheres to traditional notions of barbershops, with vintage chairs and stations, among other stylistic choices (Ocejo 2017). From the chosen artwork on the walls to the available magazines in the waiting area, these stylistic choices have been made to manufacture an image and feel within the shop (Ocejo 2017). This is a branding decision done on behalf of the barbershop to attract and retain their consumer base. Although hair salons adopt different styles, same effort is made to achieve similar goals. hair salons also make stylistic choices to brand themselves in a light that aligns with the messages they want to put forth, and the customers they would like to attract. For example, when customers step into high profile hair salons, one would be greeted by receptionist, who may also offer free drinks and guide customers to the clean and artistically organized waiting room. In said room, TV, magazines and entertainment alike will be available to optimize customer experience prior their haircut (Yeadon-Lee 2012). This differs between salons but does occur in most salons nonetheless. Both types of businesses brand themselves differently according to what messages they want to put forth about themselves, and by extension who they wish to attract. This branding is demonstrated culturally through the shift seen in upscale barber shops. New upscale barber shops do not aim to become community institutions like other barber shops historically were (Ocejo 2017). They are not institutions tight-knit based on neighbourhood or ethnicity, but rather these consumers unite because of their passion for products and techniques, and this is what draws people and maintains them in these barbershops (Ocejo 2017). This changes the narrative of what these establishments contain, shifting from a community feel with members of your own community interacting and getting a cut, compared to people uniting over the culture and passion of the industry. This is perhaps what can differentiate new upscale barber shops from more traditional ones. Among the two establishments, it is clear that service is provided but what differs is the interaction with culture and industry-specific knowledge (Ocejo 2017). These upscale barber shops act as the “cultural elites” of the industry through combining their service with their knowledge, and instilling the notion of craft within their work (Ocejo 2017). This difference in branding sets these shops apart from traditional ones, and also attracts a different population than the former. Our study on hair salons specifically, hypothesizes that changes in culture and industry-specific knowledge can have an influence on the pricing within hair salons. In addition to physical and cultural branding, Freemans has also branded itself as a creative barbershop. This is reflected in sentiment put forth by barbers, whereby one barber suggests “I would work with a lot of people who I would feel didn’t take the craft seriously. I didn’t like it,” (Ocejo 2017:86). This further reinforces the notion that this practice of being a barber has transcended simply being a service performed manually, and rather has taken on forms of meaning and a way to reflect one’s inner craft or creativity. This notion of craft within haircutting is also reflected in other literature. Yeadon-Lee’s study focuses on how the status of experts is constructed among stylists who work in high profile hair salons. The author provides an interesting analysis of the interaction between hair stylists and customers, based on the interview conducted with salon owners, hairstylists and customers (Yeadon-Lee 2012). This qualitative research showcases aspects of the micro mechanisms that high profile hair salons adopt to justify their pricing. High profile salons highly rely on their status to make their pricing acceptable to customers. The goal is to let customers perceive the stylists to be the expert. This is interpreted by the customers as being knowledgeable of the latest trends and seen as professional (Yeadon-Lee 2012). Furthermore, the interaction between hair stylists and the customers give the former opportunities to establish the expert status by informing and educating the customer during consultations (Yeadon-Lee 2012). Through consultations, hair stylists are able to display their knowledge and skills associated with hair cuts to their clients, enabling them to establish their “expert” status on the service. This is further reinforced by customers, who perceive these stylists to be experts in the topic given the knowledge communicated during the consultation. One interesting insight from this study is that receiving what they asked for is not an aspect of happy customers’ feedback. The image portrayed by hair stylists and salons to be professional and expert far outweigh whether customers believe they received what they asked for (Yeadon-Lee 2012). Furthermore, the study provides an interesting analysis regarding high profile salons branding techniques through examining the construction of the “expert” status. Our study specifically aims to quantify this creativity embedded in branding techniques, and explore whether it has a relationship with the prices in the hair salons. In our study, we will adopt elements mentioned in this article into our coding process and identify high profile salons from our sample pool, to test if salons do in fact charge more for their services based on their branding. The operationalization of branding in our study will be done by studying these salons, seeking specific keywords that reveal underlying concepts of branding. These keywords consist of expert, style, precision, craft, artistic, edgy, advanced, master, techniques, family, community, affordable, and quick. These words capture both ends of the spectrum in regards to branding with culture and creativity. Location Introduction Location has been a factor in determining what kind of people will situate themselves in certain places. Location also provides information as to which areas are more expensive, more cultural, or overall more desirable for some people. This will be explored within the relationship between business location and pricing. In regards to the relationship between location and culture, the theories presented by Patterson and Silver are referenced, Critical Mass Theory, Perfect Audience and Urbanism. Lastly, in order to observe the relationship between location and affluency, studies regarding household income, housing prices and rent are analyzed. Background Research - Location as it relates to Culture Douglas (2012:3582) illustrates how a city can be defined as one with many neighbourhoods, with it being a city that is “generally so culturally distinct and explicitly defined.” Within our analysis of the three neighbourhoods in Toronto, each one had a specific cultural identity imposed onto that was defined on an incremental level. In the case of Yorkville, it was once defined as an artistic community that housed painters, independent musicians and writers within the hippie culture of the 1960s, and is now seen as an upscale and culturally/economically affluent neighbourhood filled with luxury (Bain 2006; Mathews 2008). Kensington Market is currently seen as a place filled with cultural opportunity and diversity, but it was not always this way. In the past, Kensington Market was seen as a slum-like area that held immigrants, with not much possibility of upscaling (Caulfield 1995). The Entertainment District also had similar cultural shifts as Yorkville, in that it was defined as a specific entity within an entertainment standpoint. Darchen (2013) articulates that the Entertainment District was once described as “Clubland” due to its high frequency of nightclubs and the amount of patrons that the Entertainment District could hold, as opposed to other communities around Toronto. Slow shifts towards changing “Clubland” into an actual Entertainment District were underway after the 2000s, with large telecommunication corporations and media outlets such as Rogers, TIFF, and the CBC incrementally changing the identity of the neighbourhood (Darchen 2013). In these three cases, we feel that the hypotheses drawn by Patterson and Silver’s article coincide with the transformation of all three neighbourhoods. All three neighbourhoods follow the critical mass theory, which is when arts growth occurs in existing arts districts, which may explain why hair salons tend to operate in close proximity to one another (Patterson and Silver 2015:69). The belief for Yorkville is that due to the clientele being more upscale and affluent, hair salons will conglomerate in that area to cater to the preconceived image of affluence that the clientele wants to pursue. A similar notion can be said for the Entertainment District, with the difference being that the image being pursued is lopsided towards the “trend” of modern fashion that currently exists within the neighbourhood, rather than upholding economic status. Kensington Market and the conglomeration of hair salons could also be due to cultural “diversity” that is seen within Kensington Market, although the area is much smaller than Yorkville and the Entertainment District, which could explain the clustering. Although all three may utilize critical mass theory, the intent for each space is different. All three districts within Toronto also show the theory of urbanism being involved, in that all three are characterized as being artistic and in the case of hair salons, conglomerate in each respective district to further develop their artistic and creative endeavors (Patterson and Silver 2015). All three neighbourhoods have seen signs of population increase between the years 2006 and 2011, with a projected increase in population being roughly around 17.6% in Yorkville, a 6% increase in Kensington Market, and a 129% increase in the Entertainment District (Canadian Urban Institute 2016:43). With a cultural identity being present within each given neighbourhood, the increase in population in all three regions calls for a denser population, with creative industries such as hair salons continuing to potentially conglomerate. The density of the population in each neighbourhood calls for much easier access to certain creative industries, and hair salons are no exception to this. The discrepancy with the Entertainment District comes as a recent development plan curated by corporations situated within the Entertainment District (TIFF, CBC, CTV, Rogers, etc.) bringing in numerous amount of condominium and residential projects for the population to situate themselves in, changing the label of “Clubland” to a broadening of a true Entertainment District (Darchen 2013). As stated earlier, the low 6% increase in Kensington Market could be due to space issues and the fact that Kensington Market wants to preserve itself as a cultural landmark, thus being exempt from condominium and residential projects (Caulfield 1995). Yorkville had its shift from artistic community towards a more upscale neighbourhood much earlier, thus the more humble 17.6% increase in population (Bain 2006; Mathews 2008). For these reasons, an upshot of creative industries would likely pop up as a result, as these industries are drawn towards areas that cultivate and accept artistic value. The findings by Patterson and Silver show that densely populated areas that are culturally and artistically inclined will most likely increase arts growth via the entering of creative hair salons within the three neighbourhoods selected in Toronto. Mainly due to how the neighbourhoods are defined in some cultural aspect, the neighbourhoods of both Brampton and Newmarket are defined as being “suburban city” with a “low density sprawl” (Keil 2018). The contrast between the definition of Yorkville, Kensington Market and the Entertainment District as a culturally rich and unique area, as opposed to Brampton and Newmarket which are seen as suburban, create difference between how much artistic value is put within “suburban cities” as compared to “culturally rich” areas. We can see within our spatial analysis that the density of hair salons in Brampton and Newmarket are much more dispersed than those within Yorkville, Kensington Market and the Entertainment District. This could further substantiate the claims made by Patterson and Silver in that Brampton and Newmarket does not have an identity as an arts district to substantiate rapid art growth like the neighbourhoods within Toronto (Patterson and Silver 2015). Brampton and Newmarket also do not have a high enough population density as Toronto which can explain the weaker identity within the former neighbourhoods. The heat map for Brampton and Newmarket provided under Figures 1.3 and 3.3 of the Chain Retailer Spatial Analysis illustrates a more dispersed, consistent population density, whereas Toronto’s population density in Figure 2.4 is much more inconsistent, being concentrated within Midtown and Downtown. This suggests that the average population density of Toronto could be sizably higher within Yorkville, Kensington Market and the Entertainment District, which can provide more growth of hair salons, rather than Newmarket and Brampton, where the population is more dispersed. The findings presented in this study may aid us to contest the hypothesis around the theory of perfect audience, which is the idea that hair salons set up their pricing level according to the targeted customers (Patterson and Silver 2015). Therefore, for the hair salons located in Yorkville and the Entertainment District, perfect audience would suggest these salons charge higher prices than hair salons located in Kensington Market, Brampton and Newmarket, due to the clientele in Yorkville and the Entertainment District being able to afford higher prices. During the coding process, we will attempt to gather information regarding the recently opened hair salons to see if the frequency of new hair salons were higher within Kensington Market, Brampton and Newmarket, compared to Yorkville and the Entertainment District. This will be through collecting information on the salons and the length of time they have been open. Furthermore, the idea of hair salons reflecting the neighborhoods comes hand in hand with critical mass theory, perfect audience and urbanism, where coding of these specific theories will be attempted. For urbanism, a potential way to test the theory would be by examining two locations with high variations of population density to determine whether prices are different. Following this, we look at critical mass theory, which can be tested through the comparison of similar prices through hair salons that are in close proximity to one another as certain salons are more clustered in an areas like the Downtown core than those in the suburbs. Critical mass theory would also need to be considered if said areas are considered to have artistic influences or not, meaning that hair salons focusing on creativity and the arts should be analyzed. For perfect audience, this will be tested through whereby analyzing information on affluency of area and prices of hair salons located in those areas can indicate whether there is a relationship. This will reveal whether hair salons tend to adjust their price range based on the overall income level of neighborhoods. Background Research - Household Income / Rent and Housing Prices To further investigate affluence of neighbourhoods and cities in Toronto, we reviewed literature regarding household income and rent/housing prices. This information is collected in order to separate the regions by level of affluence and explore whether that has a relationship on pricing of salons located in said regions. Hulchanski gathered census data between 1970 and 2000 from Statistics Canada, he argues the neighborhoods in Toronto can be categorized into three groups (Hulchanski 2007). City 1 contains neighborhoods that have experienced at least 20% increase in residents’ average income (Hulchanski 2007: 3). City 2 contains neighborhoods that have not experienced any increase or decrease in average income for more than 20% (Hulchanski 2007: 4). City 3 contains neighborhoods that have experienced at least 20% decrease in residents’ average income (Hulchanski 2007: 4). In terms of size and population, City 1 represent 20% of the city, while city 2 represent 43% and city 3 embodies 36% (Hulchanski 2007:6). One of the most significant trends observed is the decrease in middle class people. Middle class neighborhoods have diminished significantly over the period between 1970 and 2000 (Hulchanski 2007). While, the population of city 1 and 3 grew, city 1 is mainly white and has very few visible minorities, who are the main population of city 3 (Hulchanski 2007:6). The locations enlisted by us in the spatial analysis signify all 3 types of neighborhoods. Yorkville, Entertainment District and Financial District are examples of city 1. Kensington market is an example of city 2. East of Scarborough is an example of city 3. The areas selected within the spatial analysis are ranked from highest to lowest based on average household income: Yorkville with $138,660, Newmarket with $116,456, Brampton with $98,855, the Entertainment/Fashion District with $91,137, and Kensington Market with $57,171 (Canadian Urban Institute 2016:17-33; Statistics Canada 2016). Our hypothesis within the spatial analysis suggested that Yorkville and the Entertainment District would be the most expensive hair salons, with Brampton, Newmarket and Kensington Market being the cheapest for hair salons. The data provided by the census would have initially contradicted this notion, since we assumed that the Entertainment District would be more expensive than Brampton and Newmarket, many factors played into the reason why this discrepancy exists. In the census provided by Brampton and Newmarket, the household income was based on a majority of them being two or more people, while the Entertainment District and Kensington Market were mostly populated by single person households. Single person households made up 62.6% of the population within the Entertainment District, and Kensington Market having 44.9% of their population dominated by single person households (Canadian Urban Institute 2016:17-33). Within Brampton, the majority of households had a total income of over $100,000, meaning that in most cases, households had more than one person living in it. The same can be said for Newmarket (Statistics Canada 2016). The reason that median was chosen over mean was because the data was skewed to the left in both Brampton and Newmarket in regards to total number of households and their income. This meant that the mean would be skewed to the left due to the high frequency of households having a household income of over $100,000. Although this is the case, the median income for one-person households was significantly lower, with $39,136 for Newmarket and $41,735 for Brampton (Statistics Canada 2016). We can thus assume that Newmarket and Brampton’s cost of living is lower due to shared household income being a prime factor towards the average and median household income, creating a large discrepancy with single person households and shared person households. Since Kensington Market and the Entertainment District have a majority of single person households, the discrepancy becomes much less noticeable, thus providing a good degree of confidence that the household income matches very closely or similarly with single person households. In a report by Zolo.ca, Yorkville’s lowest price is $2.5M for a semi-detached house (BeInToronto 2018). Whereas, Kensington Market’s the highest property being around $1.3M (Point2Home 2018). The reason for extracting the data for the average housing pricing is to determine which area had the most and least expensive housing prices, which would determine other outside factors of pricing through nearby amenities and services. Although there is a problem with fluctuating real estate prices, these prices have been updated as recently as February of 2019, meaning the accuracy of these prices should be high. Patterson and Silver also state the importance of rent, suggesting that it could be a good indicator of whether arts growth will occur in a certain area (Patterson and Silver 2015). The assumption made with the rent numbers in multiple listings as well as the census data gathered within all five observed neighbourhoods shows that the cost of living in the majority of Toronto will be higher than both Newmarket and Brampton, considering just the median single person household income. We hypothesize that along with location being a determinant of clustering of hair salons, it also has an impact on pricing within the salons. To substantiate these claims, the group will look at affluence of region, as measured by income and rent/housing prices in the given area. In order to draw the link between affluence in area and pricing in salon, the group will collect information on pricing in the salon and compare this regionally, in more and less affluent regions. The rationale behind this is that with a higher cost of living, we predict that amenities will also increase within each respective neighbourhood. There are not many articles found pertaining to rent being a factor towards differential pricing when comparing neighbourhoods, but we hope that this analysis will bring light to whether or not household income and rent/housing prices have any significant factors towards pricing of creative industries such as hair salons. Chain Retailers Introduction One key aspect of the current literature within business locations and pricing is centered around chain locations. Parachuri et al. (2009) focuses on the effects of “creative destruction” through the “Walmart effect.” Chain retailers that open in certain areas will have adverse effects on smaller, local retailers that are in direct competition with Walmart (Parachuri et al. 2009: 211-212). The hypothesis suggested by Parachuri runs contrary to our original hypothesis that the presence of chain hair salons will affect all hair salons in that given area. This is only pertinent if the hair salon is in direct competition with the chain hair salons. The literature indicates that there are more variables explaining differences in pricing other than location, which also includes branding and varying levels of population density between locations of independent hair salons and locations of chain hair salons respectively. Chain Stores - Spatial Analysis Although not included within our prior spatial analysis, hair salon franchises and chains have influenced the pricing and location of independently owned hair salons. This is largely a result of the chain’s presence being a direct competitor to these independent hair salons (Parachuri et al. 2009). In order to quantify the relationship between chain retailers and independent retailers, a chain hair salon was chosen to be analyzed. The salon of choice was First Choice Haircutters. The heat maps and population density information is provided by www.censusmapper.com and general hair salon locations is provided by Google Maps. In Figure 1.1, the franchise First Choice Haircutters within Brampton shows more dispersion within the community, whereas in Figure 1.2, the concentration of independently owned hair salons are situated on the intersection of Main St and Queen St W, just south west of Bramalea. The difference is that First Choice Haircutters chain stores are situated in a sizably spaced area with an almost equilateral distance between one another, albeit a few kilometers off. The independently owned hair salons are situated in a concentrated cluster around each other, with some stray independent hair salons being situated elsewhere. Figure 1.3 is a heat map that illustrates the population distribution and density within Brampton, with light blue being the least populated area to purple being the most populated area. A highly concentrated population density was situated within Bramalea St and Queen St W, with that block having approximately 15000 people (shown in red), and a moderately consistent population density being seen south of that with an approximate population of 17000, as shown with a green circle. We had originally wanted to add First Choice Haircutters as the only chain hair salon within all our regions, but upon further investigation, Topcuts within Toronto was also added, due to its proximity towards highly populated areas. In Figure 2.1, the franchise First Choice Haircutters within Toronto also shows large dispersion and much less frequency of locations per square kilometer than Brampton. The positions of the First Choice Haircutter locations is also spaced out in a more blatant, equilateral position than the locations within Brampton, with the exceptions of the First Choice Haircutters nearing Etobicoke (refer to Figure 2.1). As a result, Figure 2.2 illustrates Topcuts as the main hair salon chain in Toronto due to Topcuts having a high frequency around the Yonge area, including Downtown, while mainly being situated within Toronto as well. In Figure 2.3, independently owned hair salons were also heavily concentrated in specific spots in Toronto, with our spatial analysis illustrating a high frequency of hair salons within the Downtown area. Figure 2.4 shows a heat map of the population distribution and dispersion within Toronto, with the highest population density being located within Downtown and areas near Yonge Street, also showing the population density increasingly lowering outside of those areas. It should be noted that Toronto has a much higher population density than Newmarket and Brampton. In Figure 3.1, there were only three First Choice Haircutters within Newmarket, but they were also situated in an almost equilateral position between one another. Figure 3.2 shows independent hair salons within Newmarket, being clustered closely towards each other and spanning from Yonge and Leslie on an east to west trajectory, and spanning approximately two blocks from North to South. Figure 3.3 shows a heat map of Newmarket, with the population density being spread out almost evenly throughout the community, with the highest population density being distributed within Yonge Street. Similarities with all areas illustrated above show hair salon chains attempting to move away from where the population is mostly dense, unless there were no hair salons in close proximity to them. In this situation, First Choice Haircutters would situate themselves beside highly populated areas (See Figures 1.1 and 3.1). The exception occurs when there is at least one First Choice Haircutters that is situated where the most amount of independent hair salons conglomerated, although this only occurred within Brampton and Newmarket (See Figures 1.1 and 3.1). In Toronto, there were zero First Choice Haircutters that were located within Yorkville, Kensington Market and the Entertainment and Financial District, with the existing First Choice Haircutters being established in less populated areas. Although this was the case for one chain, Topcuts on the other hand, was situated in many parts of Toronto, being equilaterally spread out along Yonge Street. While First Choice Haircutters and Topcuts were more evenly spaced out, independent hair salons were closer in proximity to one another, usually in places that were highly consistent in its population density. Background Research - Chain Retailers Parachuri (2009) discusses the matter of variation between urban areas that have access to multiple amounts of retailers, and rural areas that do not have access to as many retailers. In a higher concentrated area, the demand for chain retailers is highest when the population is in very close proximity towards that chain retailer, and decreases dramatically when the chain retailer moves further away from the population. An estimated 91% of consumers visited a Walmart located near their place of residence, and when the distance increased to 5 miles, the demand lowered to 40%, and further lowered to 4% past 10 miles (Parachuri et al. 2009). The opposite can be said for those living in a lower concentrated area, where the decrease was much less despite the local retailer being situated farther away. For instance, an estimated 100% of consumers visited a Walmart located near their place of residence, and when the distance increased to 5 miles, the demand only lowered to 98%, and then lowered to 57% when 10 miles away (Parachuri et al. 2009). Looking at the spatial analysis of hair salon chains, we see that there are more First Choice Haircutters in a much smaller amount of area within Brampton and Newmarket (refer to Figures 1 and 3), with more dispersion within Toronto. In the Downtown area, there was a non-existence of any First Choice Haircutter location, although there were many Topcuts situated alongside Yonge Street in an equilateral fashion (refer to Figure 2.1 and 2.3). This may suggest that the need for hair salons in Brampton and Newmarket become more apparent due to the lower frequency of hair salons in each community, as opposed to Downtown Toronto. This can be attributed to the urbanity of Toronto in which there is not a heavy reliance on chain stores, as well as the higher frequency and diversity of hair salons that are in close proximity to one another (Patterson and Silver, 2015). Urbanity suggests that since Toronto is seen as an “urbanized” entity, the emergence of the arts will propel like-minded businesses and individuals who pursue art growth to conglomerate in areas that are denser and easier to travel without a vehicle (Patterson and Silver 2015). In this case, creative/artistic hair salons will conglomerate in these highly dense and artistic areas in Toronto, rather than chain hair salons who focus more on their utility, where they will localize in less dense areas due to the need for them rather than its artistic value (Patterson and Silver 2015). Although this is the case, we still see Topcuts being located alongside a busy Yonge St, which is somewhat counter-intuitive towards urbanity and the role of creative/artistic hair salons. The assumption is that Yonge Street has multiple sections with multiple different demographics and culture. The equilateral spacing for Topcuts along Yonge Street suggests Topcuts entering different spaces to ensure competitiveness in different areas. As with First Choice Haircutters, they are spaced in this matter as to not saturate themselves in one area. The literature also discusses this notion of “creative destruction,” which is when a chain retailer forces some independent businesses who are direct competitors to become obsolete due to them (Paruchuri et al. 2009). This creates difficulty for independent retailers to keep up with the competitiveness or the quality of said chain retailer (Paruchuri et al. 2009). This could also work in reverse, with some other businesses who are not in direct competition with the chain retailers to thrive even more, due to the chain retailer not having a niche covered (Parachuri et al. 2009). Creative destruction would mostly be relevant towards the utility and cost efficiency of the chain retailer. In the case of hair salons, creative destruction could occur as a result of hair salon chains providing a quick and cheap service that could be more desirable to some consumers, potentially putting independent salons at risk. To the point of non-competitors, there is a possibility that because chain stores do not provide the emotional or professional service that an independent hair salon may provide, those independent hair salons may brand themselves as such (Sharma and Black 2001). The literature suggests “If a Walmart opening prompted, for example, a local hardware store to fail and a new antique store to open in its place, only the failure of the hardware store has typically been counted” (Parachuri et al. 2009: 214). If a hair salon focuses solely on the quality, experience and artistic value of the haircut and brands themselves as such, they can separate themselves from chain stores who brand themselves as being cost-efficient and utility based, thus allowing independent hair salons to thrive in their own right, while other independent hair salons that do focus on cost-efficiency may experience failure. 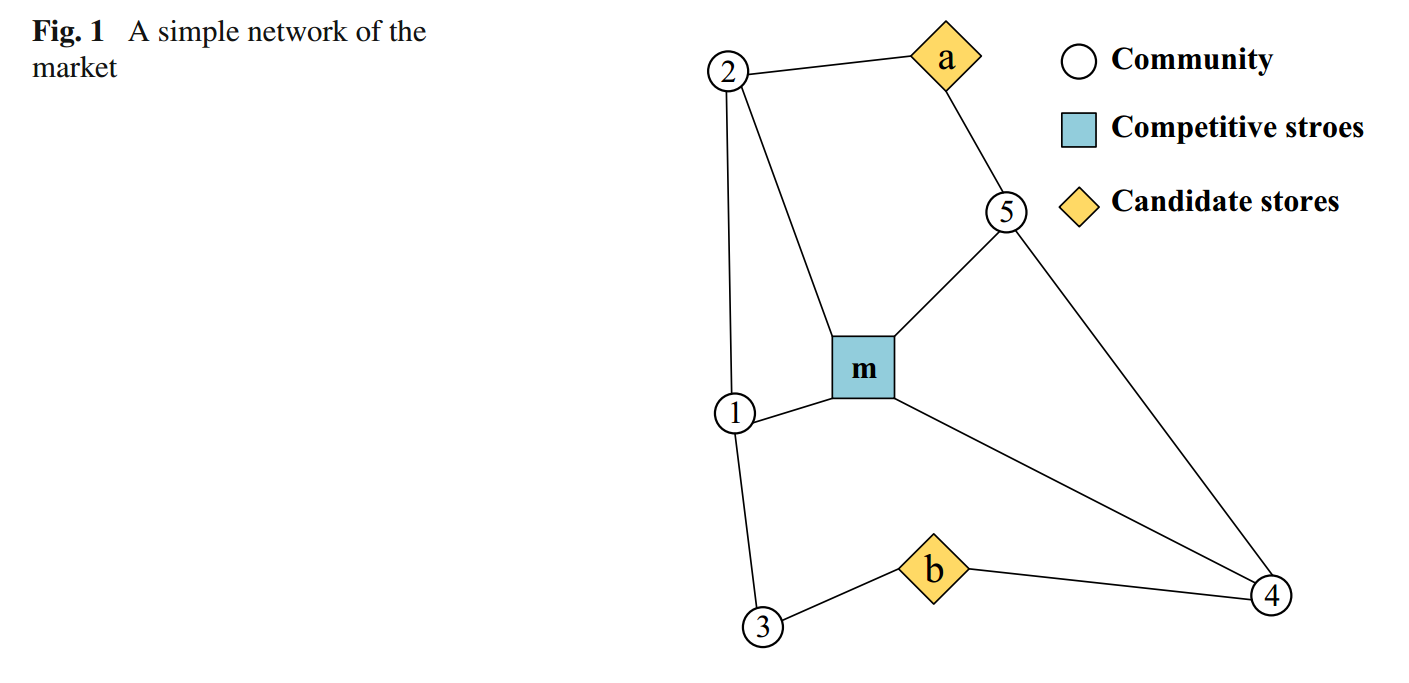 This diagram shows the effect a competitive store (a chain for example) has on stores that attempt to compete with them, where stores A and B must be closer to communities to prevent saturation of a market towards the chain store Our study will be testing the effects of chain hair salons towards independent hair salons, by comparing the difference between the former that advertises itself as a “cost efficient” hair salon and the former that advertises itself as “artistic or creative.” By testing in this manner, we will be able to figure out if direct competitors are affected by chain hair salons, and whether non-direct competitors are affected by chain hair salons. LimitationsThrough the literature, our group looked at how the pricing of hair salons across Toronto and its neighbouring areas were affected by gendered pricing, branding, and location. While reviewing the literature, there were a number of limitations and gaps within the research, which we believe our project can fill. When looking at the literature pertaining to gender-based pricing discrimination, it is noted that all relevant studies are carried out within the UK and US. One of the major limitations here is that this has not been explored in a Canadian context, or Toronto more specifically. Our project aims to address this and will explore whether gender based pricing discrimination exists within the hair salons in Toronto. This will add to the literature regarding this form of pricing and indicate whether it may be a global phenomenon or not. Literature regarding chain retailers also presented limitations. Most of the research was catered towards mega retailer chain giants such as Walmart, KMart, Target, McDonalds, and many others. The amount of research towards smaller chain stores was more sparse, so taking concepts that were found from larger retailers may have some implicit drawbacks towards these smaller chain stores. Moreover, even though observing these large chains provided information about how chains price and locate themselves, they do not address hair salon chains specifically. This is where our project can seek to fill the void in that sector, by providing information that directly pertains to hair salon chains in Toronto. The coding done by our group will allow us to analyze how chain hair salons such as First Choice Haircutters’ pricing framework compare to the independently owned hair salons in the regions. We will also be able to analyze the variance in chain and independently owned hair salons in the same geographical location, determining whether or not chains have a direct effect on surrounding independent hair salons. The literature regarding rent/housing prices also presented a few limitations. Namely, regarding the effects of rent/housing prices on the prices of services that were in close proximity to these areas. The articles were sparse in describing the effects pertaining to this relationship; we see in Patterson and Silver that the mention of average rent was made, but beyond that not much is added. Our project will seek to fill this gap and provide information regarding this relationship. Specifically, it will shed more light into rent and housing prices as a variable, and how it affects services nearby in a more concise manner. A limitation of Ocejo’s work is that it is primarily based around barbershops and their operation. This is problematic because there may be features inherent to barbershops, that may not be relevant within hair salons and vice versa. In spite of this however, the analysis provided by Ojeco regarding an aspect of the hair cutting industry is still highly informative. Even though barbershops and hair salons may have distinct features from one another, they still perform the same core functions as a business, which is cutting hair. As such, this analysis of barber shops is still useful for indicating the processes that occur at a micro level in these institutions. Our project will allows to accurately see how Ocejo’s work will hold up when being applied to hair salons, rather than barbershops. This will illustrate if Ocejo’s work can be expanded on and whether notions of creativity and branding are present within hair salons as well. In spite of the limitations encountered in the literature, there was a considerable amount of information that we were able to extract, and this was relevant in its own respect. Our project aims to build off this literature, by adding new variables and methods, while examining hair salons specifically. ConclusionWithin our study specifically, we examine the pricing of hair salons. The hypothesis put forth is that pricing within these salons are influenced by factors such as gender, location and branding. This project aims to fill a gap in the available literature regarding this industry. Namely, rather than analyzing pricing in terms of a standardized framework based on workload and skill, we take the approach of analyzing a variety of external variables that can influence pricing in the salon. This study will combine a set of factors and observe their relationship with pricing. The way in which this will be quantified is through coding observable properties, that address underlying concepts. Our study will look to shed light into the literature regarding hair salons broadly, but also the ways in which location and branding can affect the pricing models of businesses. Previous research has focused on aspects of business pricing or hair salons, however has not considered variables such as location and branding specifically. Moreover, these studies often analyze these variables independently, and not in unison, where they are considered relationally. As such, this project aims to add a new perspective in the hair salon literature, while utilizing new methods to do so. By: Nguyen Philippe Dang-Ho, Walid Fattah, Jaishree Nayyar, Sara Tawanapoor and Tianyi Jimmy Xing ReferencesBain, Alison L. 2006. “Resisting the creation of forgotten places: artistic production in Toronto neighbourhoods”. The Canadian Geographer. Vol 50(4). p. 417-431
BeInToronto, 2019. “Moving to Yorkville? The Toronto Neighbourhood Where Uptown Meets Downtown Luxury Condos and Houses Real Estate Prices”. BeInToronto. Retrieved on Feb 19, 2019. (https://www.beintoronto.com) Canadian Urban Institute. 2016. “TOcore: Neighbourhood Population Profiles”. Canadian Urban Institute. Retrieved Feb 19. 2019 (https://www.toronto.ca/) Caulfield, Jon. 1994. “Chapter 1: Contrasts, Ironies, and Urban Form: The Remaking of the Historical City”. p. 5-41 in City Form and Everyday Life: Toronto’s Gentrification and Critical Social Practice. University of Toronto Press Inc. p. 405-432 Statistics Canada, 2016. “Census Profile, 2016 Census: Brampton”. Government of Canada. Retrieved on Feb 19th, 2019 (https://www12.statcan.gc.ca/census-recensement/2016/) Statistics Canada, 2016. “Census Profile, 2016 Census: Newmarket”. Government of Canada. Retrieved on Feb 19, 2019 (https://www12.statcan.gc.ca/census-recensement/2016) Darchen, Sébastien. 2013. “The Creative City and the Redevelopment of the Toronto Entertainment District: A BIA-Led Regeneration Process”. International Planning Studies. Vol 18(2). p. 188-203 Douglas, Gordon C.C. 2012. “The Edge of the Island: Cultural Ideology and Neighbourhood Identity at the Gentrification Frontier”. Urban Studies. Vol 49(16). p. 3579-3594 Duesterhaus, Megan, Liz Grauerholz, Rebecca Weichsel and Nicholas A. Guittar. 2011. "The Cost of Doing Femininity: Gendered Disparities in Pricing of Personal Care Products and Services." Gender Issues28(4):175-191(http://myaccess.library.utoronto.ca/login?url=https://search-proquest-com.myaccess.library.utoronto.ca/docview/903153463?accountid=14771). Ferrell, O. C., Dimitri Kapelianis, Linda Ferrell and Lynzie Rowland. 2018. "Expectations and Attitudes Toward Gender-Based Price Discrimination."Journal of Business Ethics 152(4):1015-1032 (http://myaccess.library.utoronto.ca/login?url=https://search-proquest-com.myaccess.library.utoronto.ca/docview/2127725626?accountid=14771). Gee, Marcus. 2017. “The King-Spadina boom: What’s behind the growth at Toronto’s hottest intersection”. Globe and Mail. Retrieved on Feb 18, 2019 (https://www.theglobeandmail.com/) Hulchanski, D. J. (2007). The three cities within Toronto: Income polarization among Toronto's neighbourhoods, 1970-2005. Karpik, L., & Scott, N. (2010). Valuing the unique: The economics of singularities . Princeton: Princeton University Press. Keil, Roger. 2018. “After Suburbia: research and action in the suburban century”. Urban Geography. p. 1-20 Lees, Loretta; Tom Slater, and Elvin Wyly. 2007. “Chapter 1: The Birth of Gentrification”. p. 5-20 in Gentrification. New York : Routledge/Taylor and Francis Group. Liston-Heyes, Catherine and Elena Neokleous. 2000. “Gender-Based Pricing in the Hairdressing Industry.” Journal of Consumer Policy 23(2):107–26. Mathews, Vanessa. 2008. “Artcetera: Narrativising Gentrification in Yorkville, Toronto”. Urban Studies. Vol 45(13). p. 2849-2876 McLean, Heather, and Barbara Rahder. 2013. The exclusionary politics of creative communities: the case of Kensington Market Pedestrian Sundays. Canadian Journal of Urban Research, Vol 22(1). Ocejo, Richard E. 2017. Masters of Craft: Old Jobs in the New Urban Economy. Princeton, NJ: Princeton University Press. Parachuri, Srikanth; Joel A.C. Baum; David Potere. 2009. “The Wal-Mart Effect: Wave of Destruction or Creative Destruction?” Economic Geography. Vol 85(2). p. 209-236 Patterson, Matt & Daniel Silver. 2015. “The place of art: Local area characteristics and arts growth in Canada, 2001-2011”. Poetics. Vol 51. p. 69-87 Patterson, Matt, and Daniel Silver. 2015. “Chapter 21: Turning the Post-Industrial City into the Cultural City: The Case of Toronto’s Waterfront”. p. 268-280 in The Routledge Companion to the Cultural Industries. Routledge. Point2Homes, 2019. “Fashion District Real Estate”. Point2Homes. Retrieved on Feb 19th, 2019 (https://www.point2homes.com/) Point2Homes, 2019. “Kensington Market Real Estate”. Point2Homes. Retrieved on Feb 19th, 2019 (https://www.point2homes.com) Shan, Wenxuan; QianQian Yan; Chao Chen; Mengjie Zhang; Baozhen Yao; Xuemei Fu. 2019. “Optimization of competitive facility location for chain stores”. Ann Oper Res. Vol 273. p. 187-205 Statistics Canada, 2016. “Census Profile, 2016 Census: Brampton”. Government of Canada. Retrieved on Feb 19th, 2019 (https://www12.statcan.gc.ca/census-recensement/2016/) Statistics Canada, 2016. “Census Profile, 2016 Census: Newmarket”. Government of Canada. Retrieved on Feb 19, 2019 (https://www12.statcan.gc.ca/census-recensement/2016) Yeadon-Lee, T. (2012). Doing identity with style: Service interaction, work practices and the construction of ‘expert’status in the contemporary hair salon. Sociological research online, 17(4), 1-12. Zolo. 2019. “Brampton Real Estate Trends”. Zolo Realty. Retrieved on Feb 19, 2019 (https://www.zolo.ca/) Zolo. 2019. “Newmarket Real Estate Trends”. Zolo Realty. Retrieved on Feb. 19, 2019 (https://www.zolo.ca/) WHY MARIJUANA DISPENSARIES? Marijuana dispensaries have been opening in cities across Canada in response to changing legislation that supports the use of marijuana to treat certain health conditions. Indeed, the Canadian Federal government is attempting to promote the future decriminalization and legalization of marijuana for recreational use as well. These changes have made the recreational and medical consumption of cannabis an increasingly common topic of discussion. Moreover, with marijuana usage becoming normalized and the potential for the marijuana industry to grow greatly in the years to come, it can be beneficial to know where dispensary storefronts are spatially located and what influenced them to be there, which could consequently support our understanding of the culture around marijuana usage. Furthermore, Marijuana dispensaries became legalized on October 17, 2018, however, they started becoming more popular since the end of 2015 when the Federal Government announced the intention to legalize marijuana (Johnson, 2018). We are looking at the distribution of marijuana dispensaries across the five most populous Canadian cities (Toronto, Montreal, Vancouver, Calgary, & Edmonton). Our focus was on cities that are urbanized, which by definition means “the concentration of population in cities and towns” (Michaels et al, 2012). Altogether, the placement of the dispensaries takes shape in clusters around highly populated and dense areas, with the exception of a few outliers. This type of clustering is interesting to study because there is no known/recorded majority of people in terms of income, class, race, gender, or sexuality that consume marijuana. It is commonly used by all people, therefore, it is interesting to see what causes the clustering of weed dispensaries if its not the demographical characterisitcs of the neighbourhood. Possible attributions for the placement of weed dispensaries we are considering are; population, the Nash equilibrium (will be further discussed below), tourism, and possible zoning by-laws. Figure 1. Spatial maps of cannabis dispensaries throughout the five Canadian cities. Red pins indicate that they are located outside of the central urban cores. Green pins indicate they are located within the central urban cores. Pink pins indicate future/upcoming cannabis dispensaries. HYPOTHESES Prior to conducting a literature review on the subject of spatial distribution, our group hypothesized that the clustering patterns of marijuana dispensaries have two major factors alluding to business models, being: (1) consideration for the businesses (densely populated urban areas have more consumer base thanks to convenience, as opposed to sparsely populated regions); (2) consideration for the appropriate consumer base within particular neighbourhoods (retailers of recreational marijuana would fair better in neighbourhoods where their residents are well-informed about the recreational use and have positive view on the usage. To investigate the causes for the distribution of marijuana dispensaries, we consulted academic theories on clustering, and considered possible attributes for their spatial location. POSSIBLE ATTRIBUTES AND THOERIES Tourism One factor we took into consideration this time around is how tourism may play a role in the placement of marijuana dispensaries. Lorraine Taylor writes in her article that previous scholarly research “suggests that marijuana tourism is the act of traveling or vacationing to a place because of the ability to use marijuana legally” (Taylor, 2018). When travelling to different countries, tourists may be inclined to visit the downtown core of large cities as that is where they may find many different forms of tourism taking place such as events tourism, arts, sports, and more. Now that marijuana is legal in Canada, and it is known internationally, dispensaries may take marijuana tourism into account when deciding where they would like to place their storefront. Nash Equilibrium One reasoning for the clustering of marijuana dispensaries is the Nash equilibrium theory. This theory suggests that clustering offers more options to customers, and when customers see the different variations of similar products that fellow competitors provide, it may bring more attention and traffic. It is as strategy to keep competitors as close as possible. Furthermore, "Nash Equilibrium is a state where a party chooses an option that benefits them the most despite the other parties’ choices." (Chen, 2019) The proximity between dispensaries therefore motivates marketing strategies to gain an advantage over the other by differentiating their products, offering promotions, creating publicity, et cetera. These promotions, variations and number of streams/products will be anaylsed when coding. Zoning and Bylaws Some Municipalities may choose to implement zoning and bylaws to control the locations of marijuana dispensaries, For example, in 2015 Vancouver included medical marijuana dispensaries to its zoning bylaw in 2015. Furthermore, in Vancouver dispensaries are only allowed in commercial areas at least 300 metres from schools, community centres, neighbourhood houses, and youth facilities. They must also operate with a business license, with a development permit and a signed good neighbour agreement (Johnson, 2018). Where as, the only aspect of marijuana that the City of Toronto regulates is licensed producers of medical marijuana, which have their own zoning regulations. Therefore, the City of Toronto does not have zoning regulations directly tied to storefront dispensaries, and this varies between cities. We will be further analyzing the role of municipalities and by laws in the other three cities we are looking at for comparison and analysis. Accessibility Convenience is one aspect of the financial considerations that affect the decisions of business owners in choosing a location for their storefronts. Convenience in this case can be understood through the Central Place Theory, which suggests that businesses consider "range" in deciding the location, which is the "maximum distance consumers are willing to travel to obtain a good" (Prayag et al., 2012). This business model is evident in the spatial distribution of restaurants, as Prayag et al. observed in the city of Hamilton, New Zealand. However, it may also extend to other forms of businesses, namely retail stores, such as the cannabis dispensaries. In our spatial analysis, we observed how clusters of dispensaries generally formed around the densely populated areas where there is a clustering of restaurants and other services. In these areas, the range is minimal, and customers have greater access to goods and services thanks to the convenience of concentration. 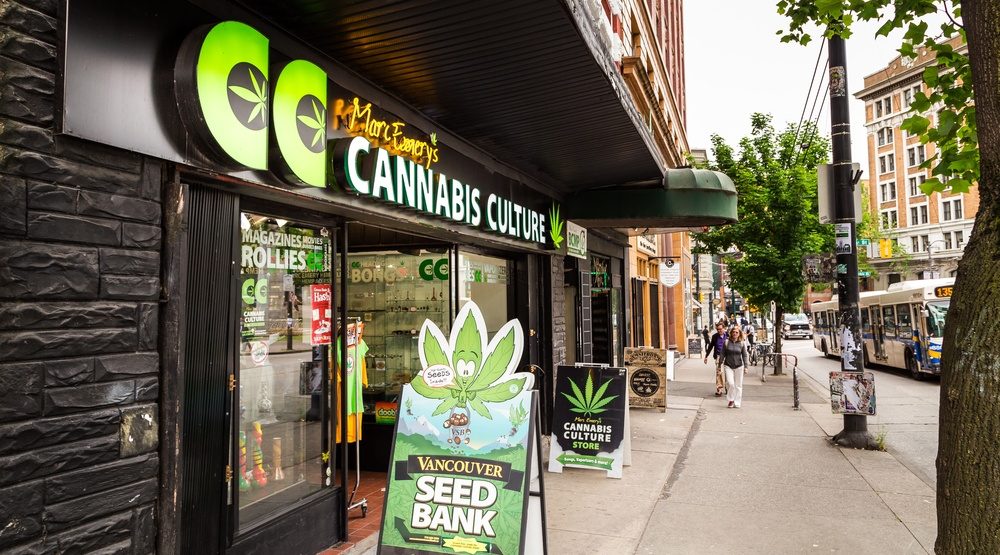 and narcityFigure 2. Cannabis dispensary in trendy neighbourhood of Gastown, Vancouver, BC.
TESTING THE THEORIES The spatial maps of the distribution of dispensaries across the five Canadian cities that we created through mapcustomizer.com using data from weedmaps.com, allow us to observe where the significant clustering of these storefronts exist within each respective cities. We can then proceed to study the demographics and significant economic characteristics of each of the neighbourhoods with the highest level of concentration of dispensaries. Most of the data on the demographics of particular neighbourhoods should be accessible on the blog cites (such as Toronto Life and Narcity) and zoning regulations can be found in each city's Official Plan. We will approach these data with focus on the population density of various neighbourhoods, concentration of retail services, and popular tourist destinations within each of the cities. LIMITATIONS OF EXISTING LITERATURE In the existing literature that we reviewed, we observed that they are limited in scope to the financial considerations of businesses. These studies do not provide any insight on how businesses such as the recreational cannabis dispensaries might be concentrated around regions that are inhabited by certain demographic of people. We aim to fill this gap in the literature by studying the characteristics of the neighbourhoods where these clusters form, in order to observe how the demographics of various regions create demand for these businesses, and create incentives to locate around clusters. REFERENCES Chen, J. 2019. “Nash equilibrium” Investopedia. Retrieved from, https://www.investopedia.com/terms/n/nash-equilibrium.asp Johnson, D. (2018). Planning for Controversial Land Uses: The Case of Medical Marijuana Dispensaries (MMDs) in Toronto” University of Waterloo. Retrieved from, https://uwspace.uwaterloo.ca/bitstream/handle/10012/13225/Johnson_David.pdf?sequence=9&isAllowed=y Michaels, Guy, Ferdinand Rauch, and Stephen J. Redding. 2012. “Urbanization And Structural Transformation.” The Quarterly Journal of Economics 127(2): 535-586. Prayag, Girish, Martin Landré, and Chris Ryan. 2012. “Restaurant location in Hamilton, New Zealand: clustering patterns from 1996 to 2008.” International Journal of Contemporary Hospitality Management 24(3):430–50. Taylor, L. Lorraine. 2018. "Defining Marijuana Tourism." Journal of Hospitality & Tourism Research 43(3): 438-446. BY: Monish, Hanna, JP, Juveriah, Irina |