|
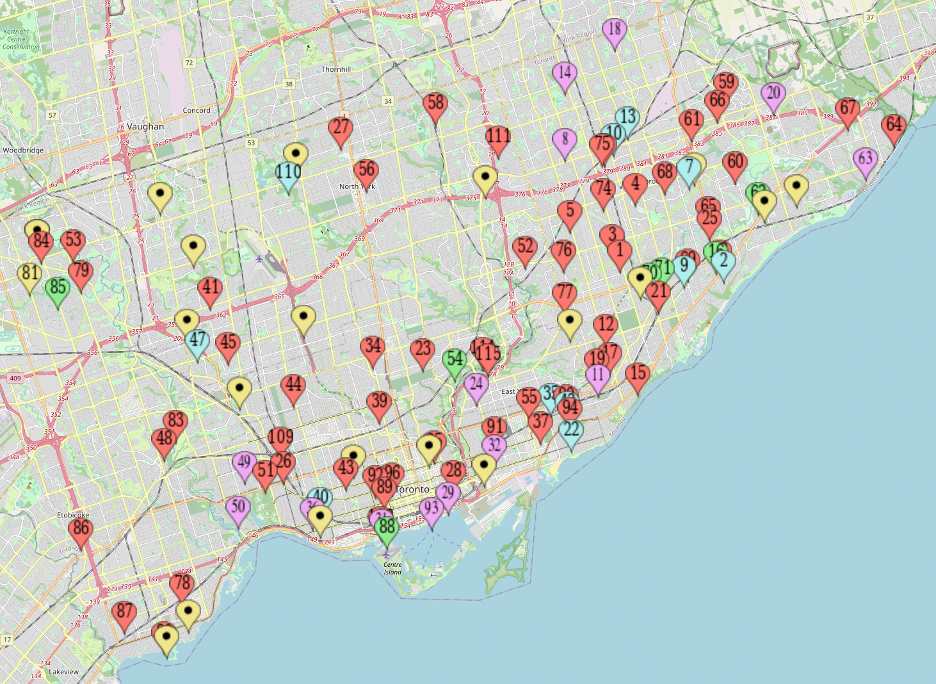
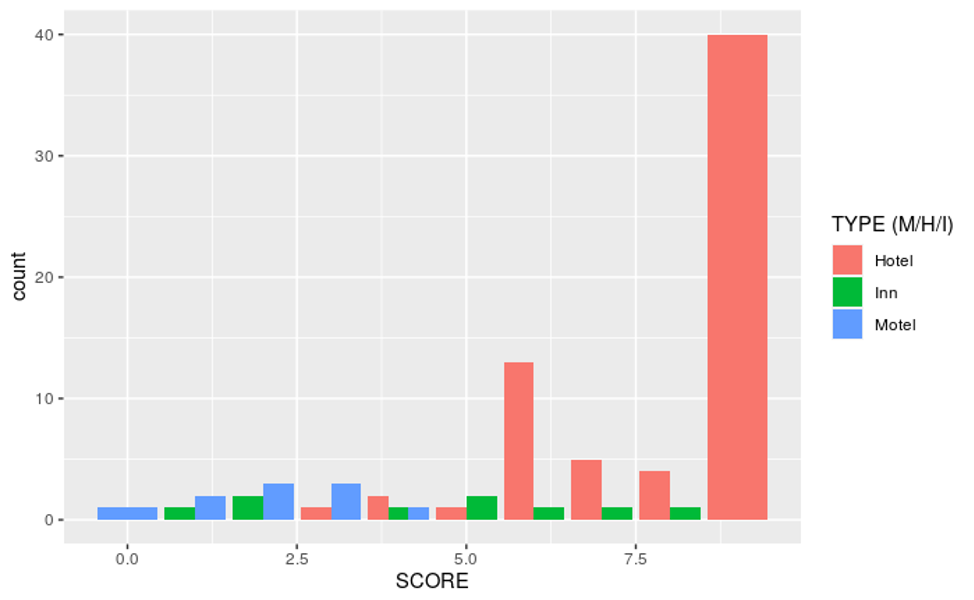
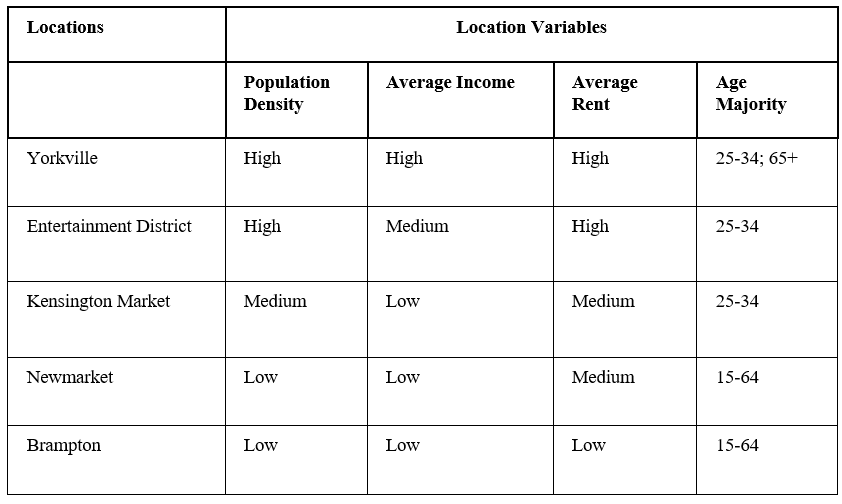
Introduction As we currently understand, music venues play a heavy role in building social experiences that are vital to one’s ability to connect, grow and thrive in a vibrant city. As a final overview, music venues have shown us that there is significant clustering, historical significance, and venue characteristics that can contribute to the cultural and creative competition within the GTA. Our previous hypotheses such as the preservation of historical venues, niche-clustering (similar spaces huddling together), or the economic efforts involved in maintaining music venues; fed into our overall question of how the small and large venues co-exist. To understand this better, we examined music venues based on their capacity, the type of music genre they play, the venue’s other purposes if any, and the frequency of music operations. Through examining these data points, we hoped to find correlations that may help us find commonalities and insights. Some of the questions we had are as follows; how do music venues resource partition and split their audiences?; Do large and small venues tend to cluster or stay away from each other? Or when it comes to operating, how do music venues differentiate from each other? Some of the theories we had were smaller venues tend to be specialist niche genres while larger venues tend to be generalist venues like the microbrewery industry. Another theory we wanted to put to test was that small to medium-sized venues clustering together to the north of the city where the income level is lower and more nightlife activity compared to the southern part of the city where we expect larger venues to be dominating the scene. Method Using google sheets, we coded up to 80 music venues in the GTA. Upon compiling the data, we are interested in 5 characteristics of the venue. First, the capacity provided the basis of our understanding of music venues, we used capacity because we thought it would provide a good distinction between large and small music venues. The largest venues follow a benchmark of 600+ capacity represented by pink, and the smallest venues follow a benchmark of <100. Second, we defined music genres based as specialist venues that cater to a specific niche like country or jazz or generalist venues that have performers from various genres, play Top 40 hits or use DJ sets. Third, we defined venues based on their ability to provide more than just music like wedding event spaces, rooftop BBQs or in-house barber shops. Lastly, the frequency of operations would show us how often a music venue will hold an event for the given month, which provides a sense of how the venue caters to the nightlife, by being open every day, or opening on selected days for selected hours. Upon coding the information based on capacity, we found 4 clusters were quite interesting to explore. 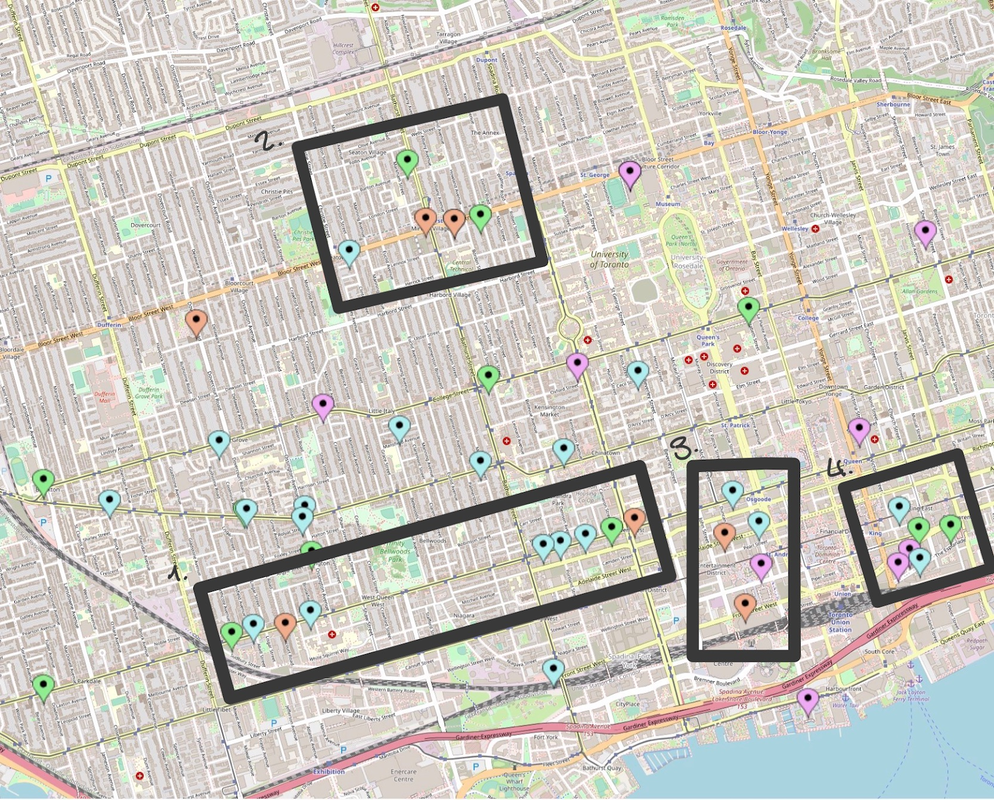 Spatial map of downtown Toronto for music venues. The map provided is colour coded based on capacity. Pink is 600+, orange is 300-600, Blue is 100-300, is <100. 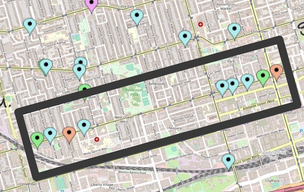 Cluster 1: Queen ST W What stands out from this map is the lineup of venues housed on Queen St W alone, known for its independent gallery walks, atmospheric cafes, and notably The Drake Hotel, Queen ST W serves to be one of the more well-known and lively streets in downtown Toronto. There are two mini clusters within Queen St, and based on capacity there are 2 comparisons we explored. Cold Tea (g) vs The Cameron House (g) Cold Tea is a generalist multipurpose music venue once located and popularized by Kensington Market now moved to Queen St. As a generalist, they cater to Top 40 hits, reggae/afro beats, and even hip hop and EDM. As a multipurpose venue when in Kensington they included an upstairs patio for Sunday BBQs that also became a huge boost for the company and their clientele. With their capacity at <100, they are the only venue of that size in the first half of Queen ST W and host up to 10 events a month. What they have done is used their small capacity to their advantage, by being in a hard-to-find location, they provide an “if you know you know” type of exclusivity that brings in a type of client drawn to what they believe will build their social capital. Given their popularity, Cold Tea owners wanted to expand to a second location on Queen West, unfortunately, COVID-19 put many landlords and their tenants, as reported on their Instagram, Cold Tea owners announced “...even after being a solid tenant for 10 years, and amidst COVID, they [landlords] refused to be reasoned with.” Given its new location, Cold Tea joins The Cameron House as another small music venue with <100 capacity. Seen as an intimate spot, this generalized multipurpose venue provides “live music and good company since 1981”. Unlike Cold Tea, the Grand Ole Cameron used to be a working hotel, and the now staple of the Toronto music scene has preserved its historical interior designs, and only improved upon them as decades came and went. By hosting up to 20 events a month with two stages, they double their frequency of operation compared to the other small venue, with live original music catering to a more rock, indie or easy-listening audience. By preserving and maintaining the history of the location, The Cameron's cultural production may have a richer social capital, in that the experience imbues tradition, a reminder of authenticity, that built the reputation of the city, practically immovable, despite the audience that Cold Tea catered too, their plea of preservation was dismissed. The Great Hall (o) vs The Horseshoe Tavern (o) What is most fascinating about this pair is their historical legacy. The Great Hall was established in 1889 making it one of the older generalist music venues on this street. This multipurpose venue holds onto its victorian elegance providing a more sophisticated music enjoying experience. With a total of 4 separate sub-venues, this multipurpose location houses between 300-600 people with about 10 events per month. Whether it is a wedding or corporate holiday, this venue provides an opulent space to enjoy music and events by the hundreds. Although this location may seem out of place in regards to the rest of the Queen st cluster, it is clear that this building has culture in its bricks, and by only pushing renovations to the 125-year-old building so far, the preservation of this venue goes beyond music consumption and into historical moments that it has housed that continues to build its reputation. The horseshoe tavern opened its doors 58 years following the great hall in 1947. Unlike the great hall, Horseshoe Tavern is much rougher around the edges, initially just a neighbourhood bar and restaurant became the host spot of country and ‘rockabilly’ performers. By the 2000s they have built quite a reputation hosting shows for an artist like Death Cab for Cutie or July Talk well known international indie and rock artists. Although it can be considered a generalist venue, its reputation attracts people that are more avid rock and indie listeners. Their reputation also attracts performers and budding artists that ascribe to that genre and are looking to show their talents. Hosting up to 20 events a month, the Horseshoe Tavern like The Cameron House both lean towards a genre that seems to double in event frequency whilst holding on to its historical significance, using that to continuously build their reputation, whereas Cold Tea and the Great Hall remain generalist overall in their genres with proportionally fewer events occurring monthly despite the great hall being larger in venue size. 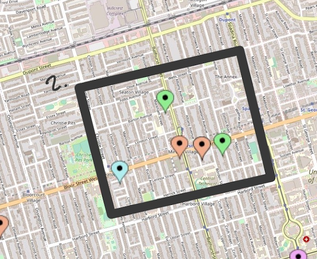 Cluster 2: The Annex This cluster is known as the Annex right next to both universities of Toronto campus, and the aesthetics of Bloor St makeup this youthful cluster. Based on their demographics, we were not surprised that this cluster is void of dress-coded, 1900s Victorian infrastructure, rather the music venues provide a less uptight, more accommodating space for prototypical university lifestyles that it has been built around. 918 Bathurst (g) vs Two Twos (g) Claimed to be an arts and culture sanctuary in Toronto's Annex neighbourhood, 918 Bathurst with a capacity of between 100-300 people, this generalist multipurpose venue prioritizes its ability to foster new and innovative arts/music venues that can bring the community together by housing film festivals, art exhibitions etc. Most notably this venue is an associate member of Bloor St Culture Corridor, an organization that includes bigger franchises such as the Royal Ontario Museum. With this partnership, this medium-sized venue can mobilize and emulate the exclusive experience of downtown's bigger cultural producers. By showing up to 10 events a month, the events are quite varied, from horror movie screenings to spoken word performances, the neighbour Just down the block lies The Annex Hotel, within it a nightclub called Two Two’s, another generalist venue that caters to all audiences musically as well as non-musical events such as wine night Monday 50% off, or comedy nights. With multiple amenities to choose from, Two Two’s has the advantage of using the resources provided by The Annex Hotel to uphold its venue audiences. Both spaces feeding off each other present an interesting dichotomy between business competition and business cooperation. While they are both multipurpose venues that house similar capacities, what they provide is unique enough to not step on the toes of other franchises, whilst feeding off the same population pool. The competition for these medium-sized venues doesn't seem to be as concerned compared to smaller venues. Coda (o) vs Lee’s Palace (o) Club coda sits quite comfortably on Bathurst St, as a generalist music-specific space. Unlike previously discussed music venues, being music specific for this club means providing live music of all genres, and no other amenities are provided to the space. Coda follows in the footsteps of its “spiritual successor” Footwork (2005-2013). Their notably 50,000-watt powered sound systems and 4 floors stacked 9000sqft space allow for a building of music-first entertainment. With about 10 events a month and a capacity of about 500 this music venue pride itself on its “connectivity and self-expression”. Void of rich historical background, website images show that this space has no problem mustering a crowd. Right beside it is Lee’s Palace, this generalist rock concert hall also specializes in the music experience. Unlike the latter music venues, Lee’s Palace has quite the historical significance to the Annex neighborhood, with 2 rebranding company titles tied to its location, Lee’s palace is made up of 2 5,000sqft floors ( less than Coda). Their use of live music by the Red Hot Chilli Peppers or Arctic Monkeys serves the youthful community quite well. The Dance Cave caters more to the alternative rock crowd, with weekly music-specific events, their closeness to Coda doesn't seem to impede much on the crowd they bring in. The use of Live music may counteract or maybe compliment Coda’s DJ sets by being so different but so close. 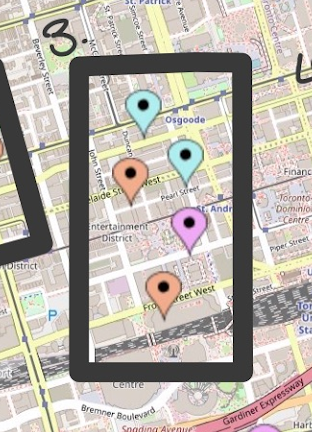 Cluster 3: Old Toronto Known as the Entertainment District, having 4 music venues in such proximity to one another, as well as one venue reaching a capacity of 600+. The spaces may be differentiated enough to limit competition, as well as heighten it. Roy Thompson Hall in pink represents the largest venue in this cluster, with an addition of 3 sub-venues, this generalist space brings in a large demographic of music lovers. From orchestra performances to comedy shows, there is something for everyone. Made in 1977 ‘Capitals of Canadian Industry’ we rallied to raise $10 million for the new concert hall, and when it opened its doors in 1982, it was flooded with vocal popstars like Maureen Forrester along with a national radio station that allowed for listers around the city to tune in not to mention a visit from Queen Elizabeth II. It is fair to say that Roy Thompson Hall has not seriously concerned itself with the competition of its surrounding venues, rather its focus remains on being a heavy cultural producer providing up to 20 events a month, this generalist multi-purpose large venue stands quite well on its own. Both blue and orange music venues are in the middle range, where they are neither small nor large venues, but their capacity still makes for quite a significant audience. The Rex Hotel Jazz and Blues Bar (b) vs SOHO House (b) The crowding in the entertainment district is to be expected given its name, and The Rex serving up to holding up to 300 people, the multipurpose venue with a bar restaurant, live jazz and boutique hotel, is a specialist known as Toronto's longest-running jazz club with an upward of 60 shows per month and about 2 live music performances a day, this business never seems to stop running. They pride themselves on being host to great Canadian artists that, “where jazz lives” coupled with winning the Downbeat Award for great jazz venue in 2011,2015, and 2018. Established in the 80s this music venue continues its legacy as a jazz club. Around the block is SOHO house, this is an international generalist, multipurpose ‘house’ that promotes itself as a home away from home, providing hotel-like amenities with an entertainment district type of atmosphere. The company has locations in the US, Hong Kong, and France, with studio spaces, event spaces, cinemas and restaurants. With its surrounding area, at first glance SOHO house seems quite redundant for a place like downtown Toronto, but what sets them apart is a membership. This exclusive pass puts other clubs and events to the test, as this venue guarantees similar up-scale luxurious lounging opportunities internationally. Their capacity as a medium-sized location for Toronto has about 20 events occurring per month, matching the trend in other locations, it is a place where you are guaranteed a good time. 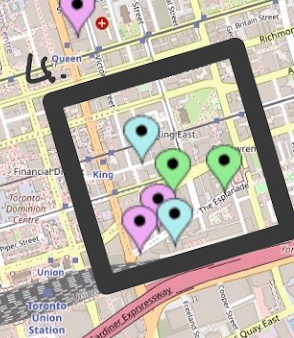 Cluster 4: King St. East Coming from the financial district, King East also has quite the historical significance to Toronto's core. Almost like wall street, this cluster is populated by blue-collar workers, CEOs and everyone in between. Meridian Hall is a generalist, housing all types of performing arts events, and is also known as the country's largest soft-seat theatre. This hall was made by their owners the Toronto municipal government. Unlike other venues with a large venue at capacity of almost 3000, this stage caters to the Toronto Symphony Orchestra, ongoing musical productions, and even free dance classes. Right across the street is Bluma Appel Theatre inside St. Lawrence centre for the arts, which is almost like a sister venue to Meridian Hall. Due to its proximity, the theatre itself reaches a capacity of about 800, which still makes them a large venue, which would further our understanding in that they are not in heated competition with one another, rather this seeming elegant mashup of music, theatre and art, the business side of this district does not suppress their engagement with the creativity outside the towering buildings. While there is another venues in this cluster, no other clusters have two large venues in such proximity. What is most surprising about the smaller venues are both multipurpose venues that put them in a comfortable competition with other venues. Graphs 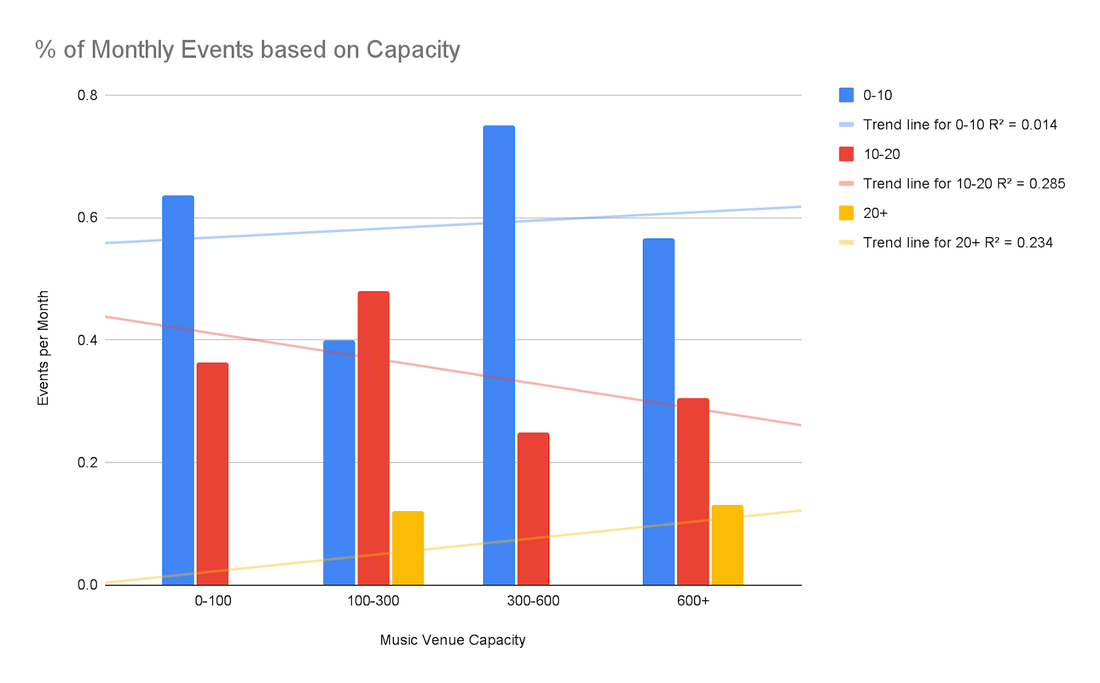 Chart 1: % of Monthly Events Based on Capacity Following the collection and analysis of our data, we discovered several fascinating relationships and astounding findings among all of the factors we analyzed. Our group made several various educational estimates regarding music venues in the GTA region at the beginning of the project; especially, we expect that music venues with greater capacity will have a favourable association with the frequency of organizing events in this place. However, based on the graph1 data, the findings indicate that there is a very weak association between capacity and the number of events held. Specifically, music venue holding places with capacities of 300-600 and 600+ have a lower rate of monthly concerts than music venue holding places with capacities of 100-300. Bluma Appel Theatre, for example, has more than 600 seats and only has a few advantages in the frequency of conducting 20+ events per month. We think that the explanation for this outcome is that people aim to attend music venues that appeal to their interests, and the location of the event is unimportant. As a result, it is fair to see a tiny pub packed with people because a specialist rock band is performing there. 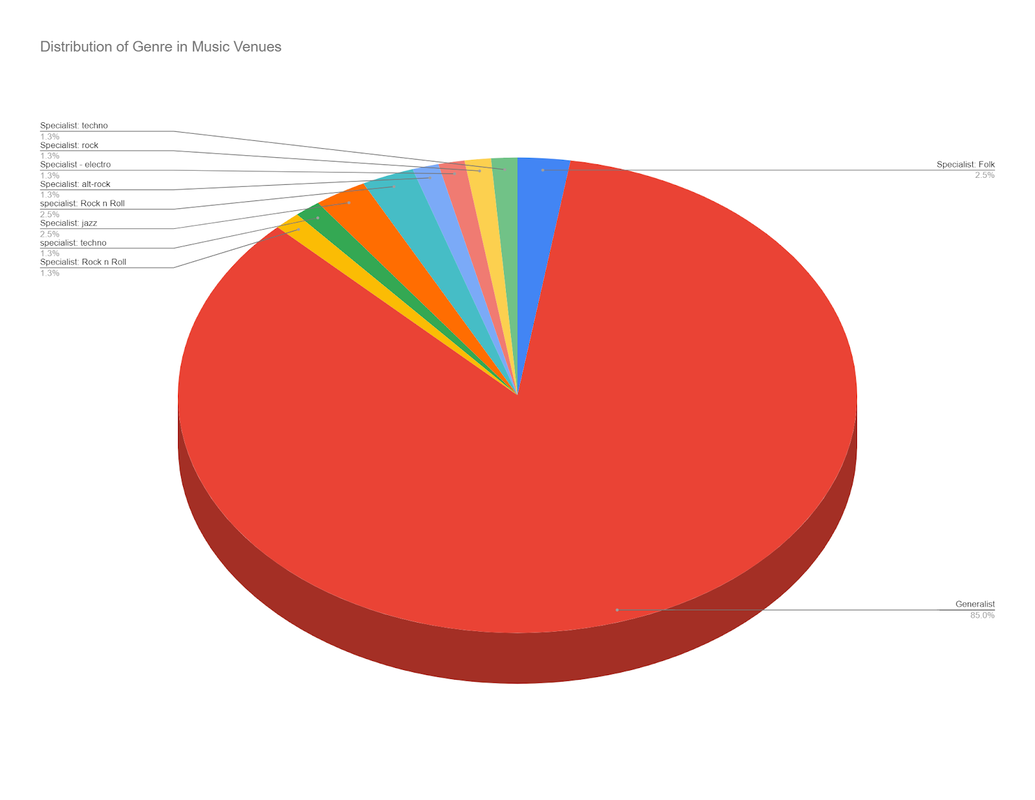 Chart 2: Distribution of Genre in Music Venues Another notable finding is among the 80 music venues analyzed, Sixty-eight percent of these establishments are designated as generalist music, which implies they will allow all forms of music performances, whereas specialized music venues only accept specific genres of music performances, such as jazz or blues. The Rock N Roll specialist music venue, which occupies 3.8 percent of all the music venue sites is the second most remarkable part after the generalist music venue. Jazz as a major music venue is ranked third out of all 80 subjects assessed. While further study is needed to determine why this is the case, our group believes that financial circumstances—catering to a wider audience—play a big factor in why generalist music venues have become the significantly dominant genre in the GTA area. Another aspect that may contribute to the expansion of generalist music venues is the multicultural municipal policy, which encourages venue owners to be more welcoming of different forms of music. 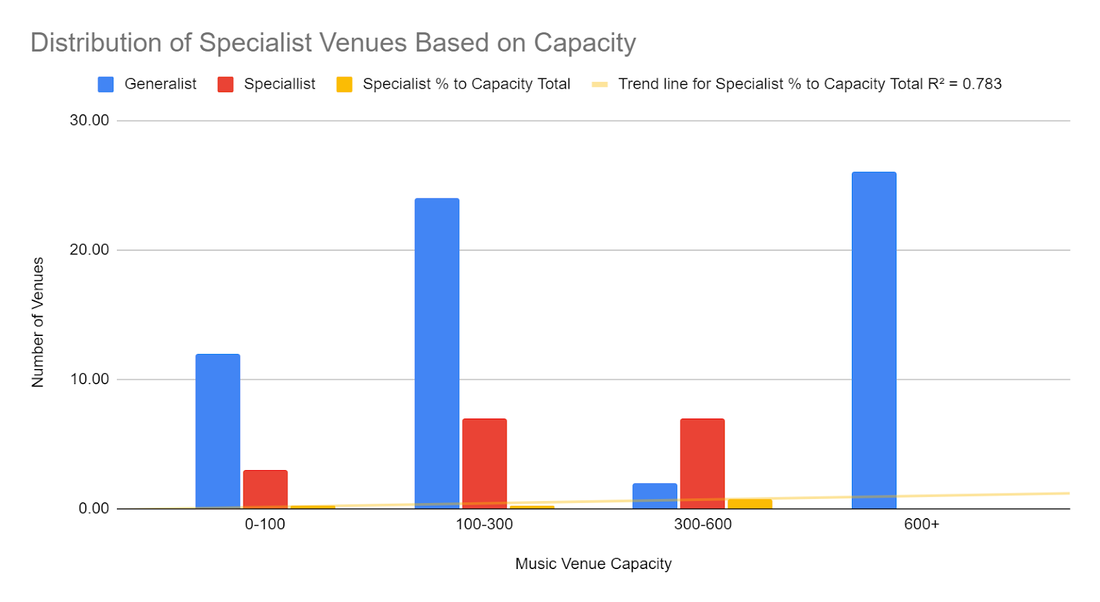 Graph 3: Distribution of Specialist Venues Based on Capacity Third, our group is curious about if there is a link between music venue capacity and the number of venues that hold it, as well as whether the relationship between capacity and the type of music venue. According to our first hypothesis on this question, we all believe specialized music venues are smaller than generalist music venues because they cater to a specific demographic, and people typically regard attending specialized music venues as a social gathering activity to celebrate a shared hobby or culture. However, as shown in graph three, the real situation is the polar opposite of our idea. Specialized venues tend to have greater capacity, except for one that can contain more than 600 people. This is counterbalanced by generalist venues being high in number but low in event frequency while specialists are very few, and tend to have a higher event frequency Additionally, it is worth mentioning an interesting fact drawn from graph four is that Specialist venues do more music events compared to generalist venues. Take a closer look at graph 4, which shows that as the total number of events held increases, the amount of generalist venues has a decreasing trend whereas the amount of specialist music venues has a slight raising trend. 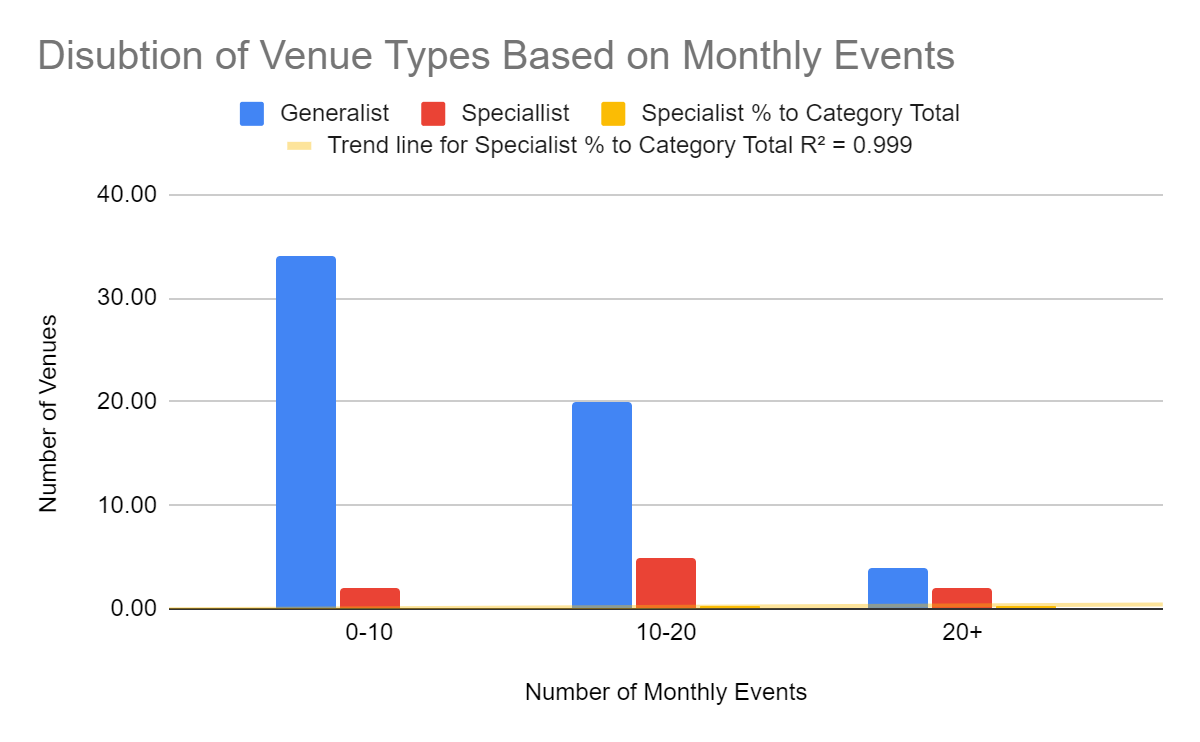 Graph 4: Distrubiton of Venue Types Based on Monthly Events Lastly, our group intends to show the strong correlation between Music Specific venues to be Specialist Genres. Specifically speaking, while taking a look at the generalist part, there are a lot of places that might be identified with the multi-purpose place since it may provide services like food and other services. However, when a place is classified as a specialized genre, it will always be music-relevant events or services. This founding is conform to the initial hypothesis we made about the specialized music venues. 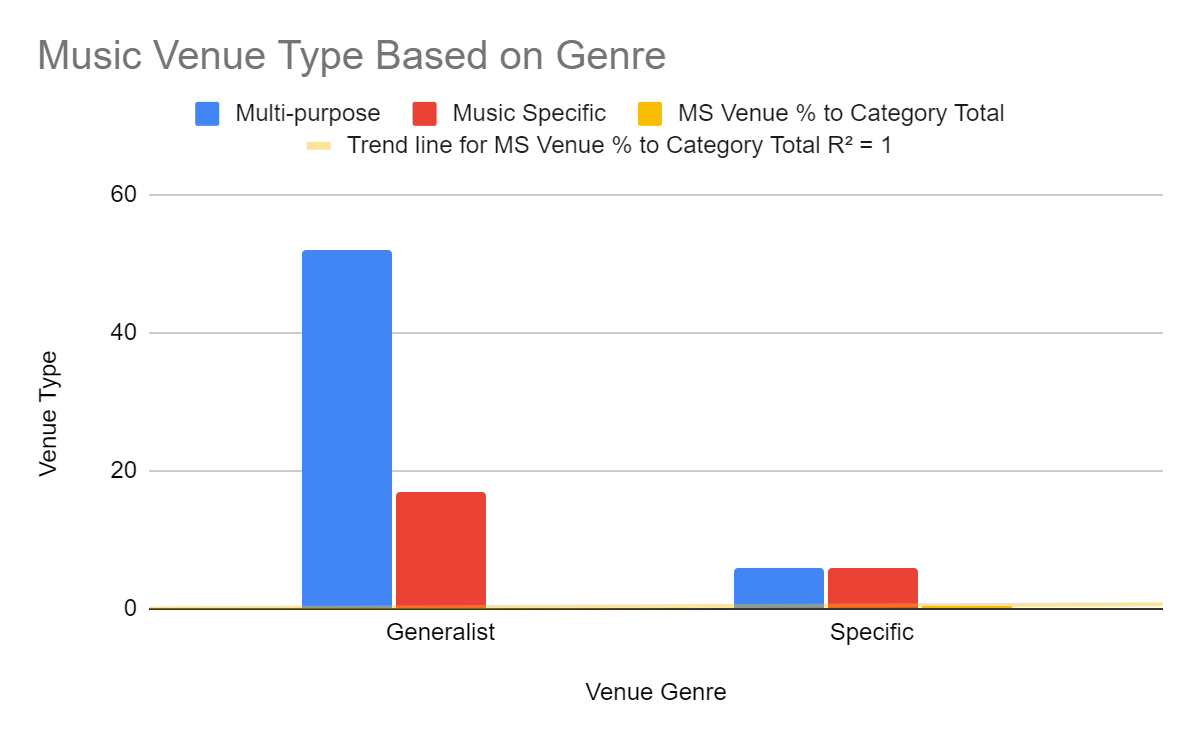 Graph 5: Music Venue Type Based on Genre So how do small and large venues co-exist according to graphs:
There are two main routes for a music venue, going music specific, or going general. Most venues tend to go with the generalist genre route. This is because both large and small venues employ the strategy of offering as much as the customers want. Large music venues are unsurprisingly most generalist since their main purpose is to function as places that allow hundreds of people to enjoy music in the same spatial place. Moreover, large music venues hold concerts and tours for artists and singers whose specialty is different from one another but falls into several genres, it must’ve gone down the road of being a generalist music venue. Similarly, small music venues, though they do not have access to hold popular singers’ concerts, they often invite local music artists to perform. This leads small music venues to encompass more diverse music genres. Venues that go music specific, often cater to a specific niche. And since specialist venues tend to do more music events, those who go the generalist music venue route tend to employ other means of revenue by being multi-purpose. This also extends to larger venues being a generalist rather than a specialist. Another finding is that while genre specialist music venues can get quite large (300-600) and tend to do so, no extremely large venue can sustain itself by being tied to a specific genre. Finally, being multipurpose, thus diversifying income streams are employed by all venues of all sizes almost equally. By the way, we look at map distribution, both large and small venues coexist close to each other. Discussion + Themes Competition The data we coded revealed a natural sense of competition in the downtown core amongst venues with some notable variations in trend. When seeking to understand the cultural effect of live music and events spaces, using available data might also help us understand the industry structure, and nature of competition, in the live music arena. This type of qualitative, peer-informed framing is important, not only because we desire an understanding of the social and cultural impact of these spaces, but also because of limitations in this group's ability to collect and code such detailed data, given constraints of time and available resources. Issues Venues Face A 2019 Re:Venues survey identified five key challenges that music venues faced before the COVID-19 pandemic. Vendors listed the top five as:
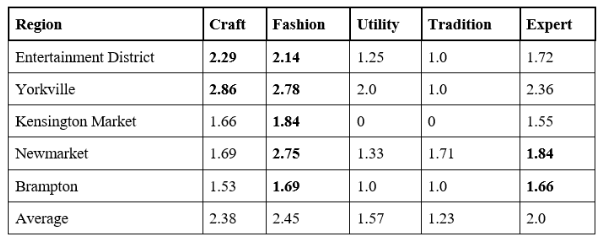
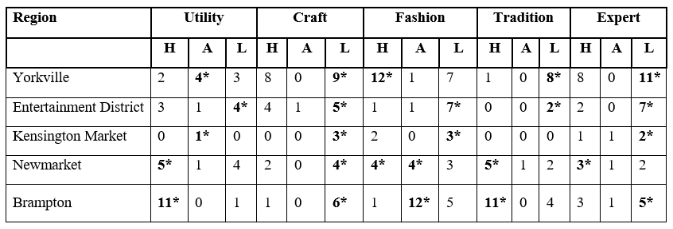
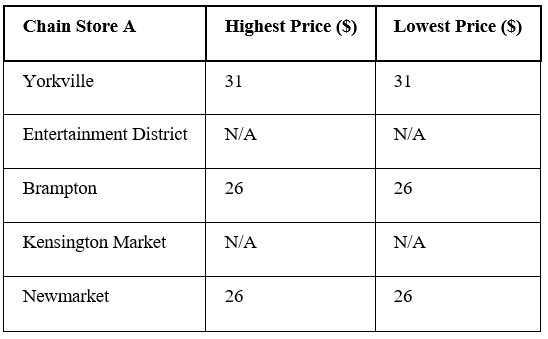
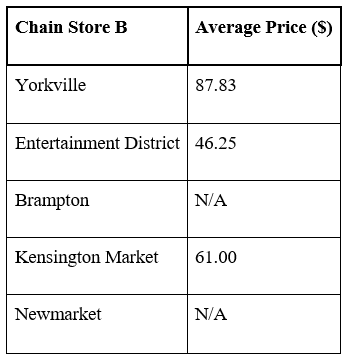
The way we have chosen to code our research by venue capacity presents an interesting framing for the effects of venue size and scale on market and competition. Deferring to Carroll’s research on resource partitioning in the microbrewery industry, three general hypotheses were outlined that, when framed in the context of the live music and events spaces market, may direct us in finding predicted correlations in the information we have coded. These relationships should be contextualized and enriched by this framing of “scale”. For the purposes of our research, we interpret scale as a venue’s patron capacity, but this could also, in other cases, be observed as cultural production capacity, or influence in other scenarios. This section also focuses on pre-pandemic data to reflect a market at its peak, which should urge readers to consider how the pandemic may have affected these findings. While these scale-based relationships can tell us different things about competition in this space, the Carroll article paints an especially interesting juxtaposition to our research when one considers Nordicity’s 2019 report on Toronto’s live music venues shows that drink sales in 2018 accounted for a reported 53% of revenue for music spaces (Re:Venue, 2019). With only 81% of venues in the city holding liquor licenses, venues must rely on other streams of income to make up this gap in revenue (Re:Venue, 2019). Food sales follow drink sales in this regard, representing 15% of revenue earned, while facility rentals (both for and apart from music), admissions, and events revenue (e.g., coat check, fees, etc), account for 6% respectively (Re:Venue, 2019). These factors, and their respective scales, can be seen as key areas of distinction that keep businesses competitive in the most general sense. Federal, municipal, and provincial grants, as well as sponsorships represent 8% of reported revenue altogether according to the same report. These factors were seen as less impactful which would put greater emphasis on the food, drink, and general musical offerings at each venue. Resource Partitioning Carroll first hypothesized that as market concentration rises and resources are more greatly partitioned, the founding rates of specialist organizations will also rise, while their mortality rates will fall (Carroll 2000). In Carroll’s framing, a specialist venue would choose a narrow homogenous focus while a generalist chooses targets composed of heterogeneous segments. When observing the extremely skewed distribution of generalist and specialist venues in Toronto’s downtown core, one might be surprised by the overall number of high-capacity venues but should consider that most of the specialist venues we identified had a capacity between 100-300 patrons. However, this is because of our framing of specialist venues as places that offer a homogenous listening experience. Generally, Carroll’s first hypothesis holds true as we noted approximately 25 high-capacity venues, which exceeded our expectations. Specialty venues were found to reflect a focus in country, folk, rock and jazz music with an average capacity between 100-300 patrons*. Carroll suggested that as competition amongst generalist venues reaches a certain equilibrium, the number of surviving specialist establishments should increase, though the resources shared by all generalists should decline. Looking to figure 4, we can observe that most generalist venues are maintaining themselves off of up to 10 events per month, and leaning into their non-musical offerings to stay competing. This may make the operation of these spaces seem very removed from musical production, but might better reflect the realities of operations management, where much time is spent in preparation to keep doors open and lights on. The realities of this are evident in the green plotted points of our map, which represent venues of the smallest capacity. Resource Distribution and Product Diversity Carroll’s second hypothesis presents the idea of resource distribution, suggesting that where competition is based on scale, the greater a firm’s distance from larger competition, the higher the organizational mortality rate. In the case of venues of the smallest scale, this appears true. In these venues we noticed a trend by which places with a small capacity do not generally cluster near each other. This suggests that smaller venues, who are fighting for resources, remove themselves from competition with each-other, instead operating more closely to venues of a capacity of 100-300, or 300-600. This suggests that those smaller venues can stand only a moderate amount of competition. It may also explain a degree of coexistence, or general equilibrium in competition of moderately sized venues. OUr mappings show only one cluster, Old Toronto, where a venue of a capacity between 0-100 can coexist in proximity to a venue with a capacity of 600 and up. In this we observe that venues in the 100-300 patron capacity are plentiful in the downtown core, and indiscriminately clustered, reflecting that these venues have the scale and means to thrive from being so closely positioned with other music spaces. This hypothesis also suggests a general increase in generalist product homogeneity. Carroll refers to studies in music which highlight that “product diversity and innovation decline with generalist dominance and consolidation” (Carroll 2000) . This trend we observed to be true. When each venue is largely held up by drink sales and food services, the experience of deciding on which to choose depends on a myriad of factors. We propose that in music spaces, where product diversity is low, the distinguishing factor for customers would be what they feel to be a unique, or subjectively specialized offering. Zoning and Regulation In context, one must also consider the distribution of resources as a negotiation between the interests of venue owners, patrons, and governing bodies. Certain zoning by-laws limit the organization of music venues as well as their establishment. When navigating the socio-economic landscape of live music, one must account for “invisible actors” shaping the scenes. These same zoning regulations can be reflected in conversations about gentrification, and its effects on live music scenes. According to Nordicity’s 2019 report, “many venues operate in a “gray area” in which they are technically licensed as restaurants, but their activities often reflect those of an entertainment establishment or nightclub.” (Re:Venue, 2019) The same report suggests that zoning and regulation add to the complexity of operations in that one must also compete with established rules and regulations to thrive. Carroll’s positioning was one of In the case of music, this could stand to mean that specialist venues are so distinguished from the market that they “distance” themselves from the rest of the market by being deliberately niche. In the case of generalist venues, one can create this distance, very literally, through the built environment. Authenticity and Identity Based Competition In Carroll's third hypothesis we can make a case for identity based competition. Carroll posits that “under resource partitioning based on identity, the legitimating effects of specialist organizational form density depend on the form’s normative valuation relative to identity claims (a) and its social visibility (b)” (Carroll 2000). While we have noted that amenities apart from live music bolster the business of most establishments, it should also be noted that relative to placemaking and the idea of “branded experiences” at venues, there is often a management team or booking manager responsible for curating the ambience of a venue. When we think about competition in music spaces, we think about this ambience and placemaking as an important site of focus. Brian J. Hracs’s research on music scenes in Toronto and Halifax reports that “[those] playing in different musical genres rarely encounter each other. Thus, the scale of the Toronto city-region limits social integration within the scene” (Hracs 2011). To make a space feel more authentic, acts are booked in to help draw customers. A venue’s visual aesthetic, capacity, and the schedule of acts they book are all factors that may contribute to a perception of relative authenticity in a live music space. This research, despite its limited focus on physical places in context, can prompt important research into the role of those who give meaning to these places. Artists, booking agents, business owners and managers, and customers all contextualize a space for its relative meaning and, at the same time, its ability to provide an authentic experience. Booking agents especially empower venues by curating talent that competes for customer attention day-to-day while promoters work to ensure that the businesses actually draw crowds and maximize the potential of their capacity. Given the myriad of generalist and multipurpose events spaces in the city of Toronto, it is the booking agents that have roused our interest for further research as they are actors that contextualize the experience of visiting live music venues from behind the scenes. Limitations While collecting data, we unsurprisingly ran into several venues where we couldn’t collect a couple of data points, which we marked as N/a on our datasheet. Where applicable, we did not include the venues with a not applicable data point for the respective chart. While this causes some of the charts to have more data entries than others, the highest number for excluded venues in a chart is 3, which does very little to the larger trendlines for a data set of 80. Another caveat we had to do was venues that operate in summer, such as Budweiser Stage. For any venue that has music events only during summer, we assigned the venue to the 0-10 events per month category as a way to compensate for the lack of activity compared to year-round venues. Conclusion In conclusion, by coding up to 80 music venues in the GTA and visualizing our statistics into multiple graphs, we were able to test our hypothesis. We found four significant clusters of music venues across Toronto. Firstly, Queen Street West is a cluster of mostly generalist niche music venues that encompass a rich historical legacy. Secondly, the cluster in Annex is filled with multipurpose, less uptight, and more accommodating music venues since they are located near the University of Toronto, which makes sense to adopt a more inclusive and vibrant atmosphere rather than a sophisticated yet formal vibe. The third cluster is within the old Toronto district, which is also known as the entertainment district. This cluster of music venues tends to be located close to each other, however, they vigorously differentiate from one another so that the competition is not quite visible in this area. The fourth cluster is made up of two venues, the large venues are right across the street from one another, and despite being surrounded by smaller and medium-sized venues, both contribute quite heavily to the cultural production of the GTA by providing exclusive music listening experiences, engagement with the performing arts, and free engagement with the immediate community. With the visualization of our data, we can draw some visible characteristics of music venues in Toronto. We found that there is a rather weak tie between capacity and the number of events held. Another prominent yet unsurprising finding is that 68% of the music venues that we studied are designated as generalist music venues. Regarding the connections to literature, our map correlates to Carroll’s second hypothesis that venues with a capacity of up to 100, are generally located far away from the others. Unlike small venues, large music venues don’t cluster together. References + Sites https://docs.google.com/spreadsheets/d/13kpEZ7JlrtS_V4MuvwdJuJBGQ1NgdoQjcJquoQzzPH0/edit#gid=1191918837 https://www.mapcustomizer.com/map/Music%20Venues%20w%2Fcolour%20based%20on%20capacity Carroll, Glenn R., and Anand Swaminathan. “Why the Microbrewery Movement? Organizational Dynamics of Resource Partitioning in the U.S. Brewing Industry.” The American Journal of Sociology, vol. 10, no. 3, 2000, pp. 715–62, https://doi.org/10.1086/318962.
0 Comments
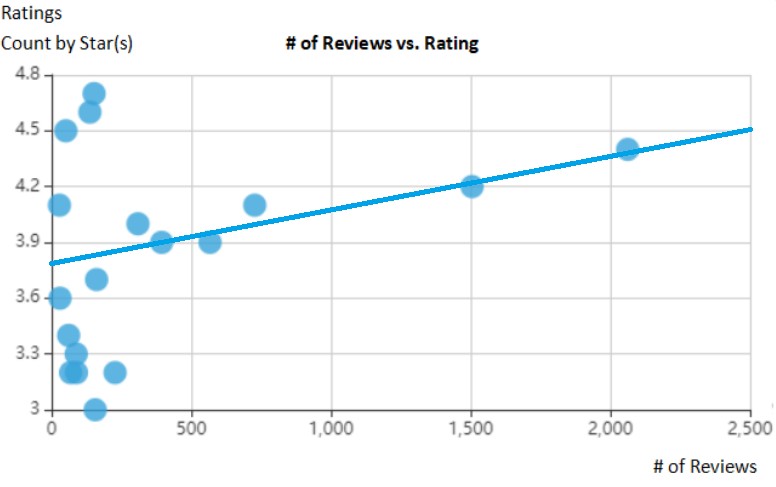
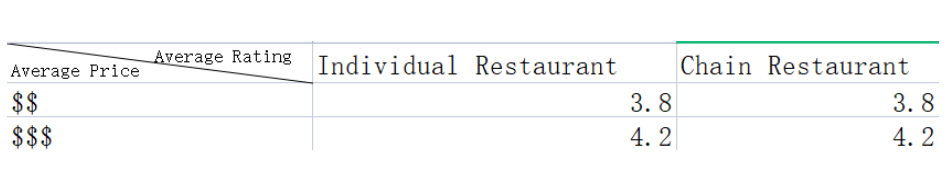
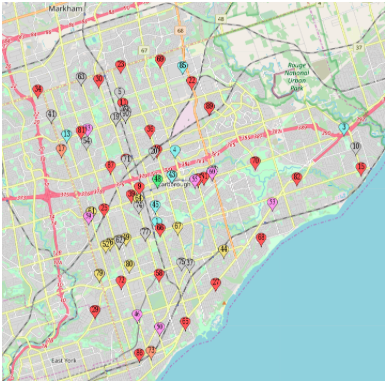
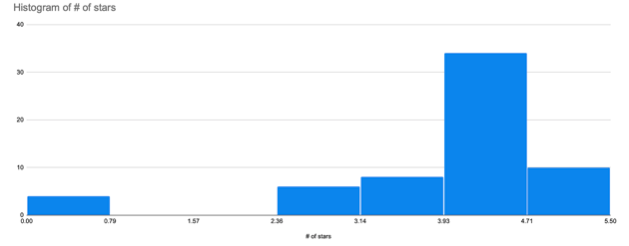
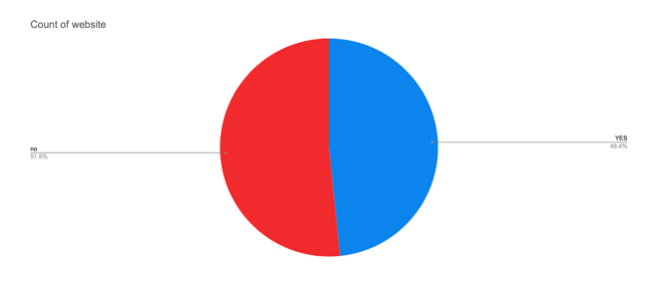
Introduction: Through our previous work on the background research and spatial analysis in cheap vs expensive restaurants in the GTA, we have focused on the reason why certain restaurants cluster in specific locations. With our spatial analysis we assumed that restaurants would cluster depending on price, meaning that expensive restaurants would be located more in the downtown region while cheaper restaurants would be spread around the Greater Toronto Area. As we dive deeper into our background research, we then focused on four possible hypotheses to explain the clustering of restaurants such as; all restaurants cluster, certain types of restaurants cluster based on location, certain types of restaurants cluster based on restaurant orientation, and lastly certain restaurants cluster based on specific constructions. In this coding analysis, we have narrowed down our research and chose to analyze these restaurants by looking at the type of restaurant, their ratings, the language of menu provided, the # of reviews, whether the restaurant is cheap or expensive, and the region of that specific restaurant. This information will be gathered through yelp which will help show us if there are any relations between our variables and the location of these restaurants.Our research question is why expensive restaurants tend to cluster in the downtown area? Through close examination of our research we assume that depending on the location of a restaurant, we found that expensive restaurants cluster closely together downtown due to location selection. https://docs.google.com/spreadsheets/d/1qW07wSfZZCZxBxYwNuQSkiruNbDIP6sBqlAWPJejPrY/edit?usp=sharing Methods: Our general idea was to focus on the most expensive and cheapest restaurants in the GTA, we were able to narrow down our search through Yelp and came up with 50 expensive and 50 cheap. These restaurants that were distributed in our spatial analysis were then used again in our coding system. The same 100 restaurants were used for this research as we decided to have 7 variables to code and analyze in our data and graphed 5 variables to help support our research question and that we felt were the most salient information in our data. Our first variable was the type of restaurant which was the type of cuisine each restaurant was specializing in. Our second variable was the number of ratings, and this was based on a scale of 1-5 on Yelp. Our third variable was language, we coded 1-3 for 1= english, 2 =non- english, and 3 = both that each restaurant had on their menus. Our fourth variable was website, and this was a simple Y (yes) or N (no) if the restaurants had a website. Our fifth variable was the number of reviews, we collected the total number of reviews each restaurant had on Yelp. Our sixth variable was coding the restaurants as either cheap ( c ) or expensive ( e ). Our last variable was region, we located all of our restaurants and coded them as either 1 = downtown, 2= scarborough, and 3 = other/outlier. These variables and our coding system overall helped to understand the spatial distribution of our restaurants. Hypothesis: Certain types of restaurant cluster amongst each other depending on the location Restaurant clustering for expensive restaurants is based on location selection and this is based on internal agglomeration, which is a clustering of similar type of restaurants within key locations (Jung and Jang: 2019) . It is a key factor for the success and distribution of these types of restaurants clustering together that are on the expensive end. Our hypothesis is supported by the work of Jung and Jang (2019), who explain the idea behind central place theory in terms of why expensive restaurant tend to spatially cluster together in the same areas, and this is based on external agglomeration which is greater due to the fact that consumers transportation time and cost would be reduced with these types of establishments being clustered in central business districts and hubs filled with people like downtown core. A key point is that distance is an important thing to consider for consumers, so it is found that consumers travel farther if a product is expensive and important, and this the case for expensive restaurants when they are are similar and clustered together spatially in downtown Toronto, it would logically make sense from a consumerist perspective why this would work and this would in turn reduce search costs for customers if many similar type of restaurants are cluster together with similar price ranges, images, and concepts this would target a specific audience and group of people to travel to a central place to have options in consuming this the same type of establishments that are similar to one another, thus location is an important factor for these expensive restaurants. 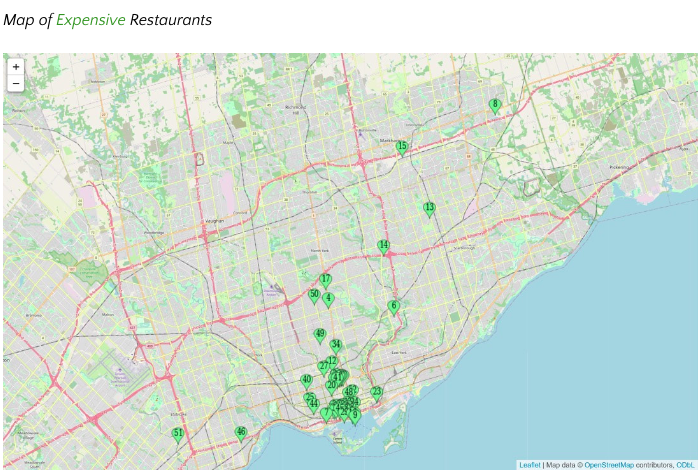 On the other hand for lower priced restaurants are likely to cluster closer to consumers and where they live than higher priced restaurants because the cost of consuming food at a lower priced place will increase more if the location moves farther away from consumers (Jung and Jang 2019: 450), the point is in comparison that you need time to travel downtown so there’s a reason higher priced point restaurants cluster there. Since demand is fixed and uneven in terms of space and location, lower priced restaurants tend to not cluster within one region so there’s a reason why you can find cheaper restaurants sporadically spaced out, “Based on this difference in perception by price, many high priced firms tend to locate within the central business district, while a large number of low price and price sensitive firms tend to locate outside the central business district and closer to where customers live” (Jung and Jang 2019: 450). 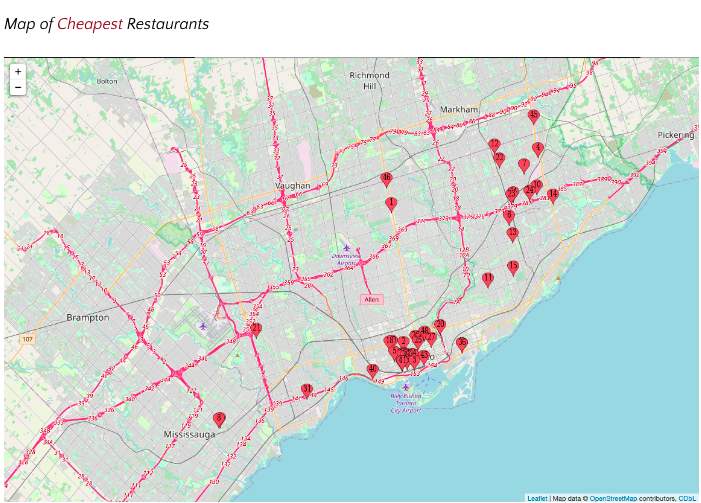 Results: In this section we will briefly explain our findings after our coding analysis. After analyzing our results from our coding analysis, we noticed that there were trends within our variables. When taking a look at our variables we were able to discern interesting findings for our core 5 variables, some being the top cuisines that consumers would eat, what menus across our cases looked like in terms of languages used, and most importantly discerning spatially where our restaurants are located through our region variable. 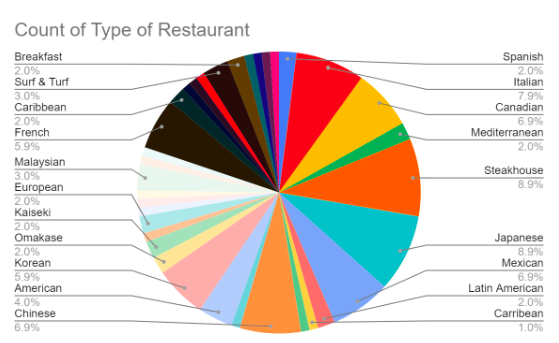 With this pie chart, this was a step away from a bivariate analysis as we wanted to incorporate all the different restaurants and the ethnic cuisines that they are presented in our data. To be more specific, the independent variable would be the type of restaurant/cuisine that is being specialized and the dependent variable would be the quantity of restaurants. As shown above, we noticed that a lot of restaurants chose to specialize in Steakhouses, Italian, and Japanese cuisines. When we relate this to our recent findings in our spatial analysis, and background research it was a common trend that these three cuisines were the most expensive restaurants that consumers would eat at. That being said, these expensive restaurants also turned out to be located in the Downtown area district which correlates to our central place theory and our location selection hypothesis. 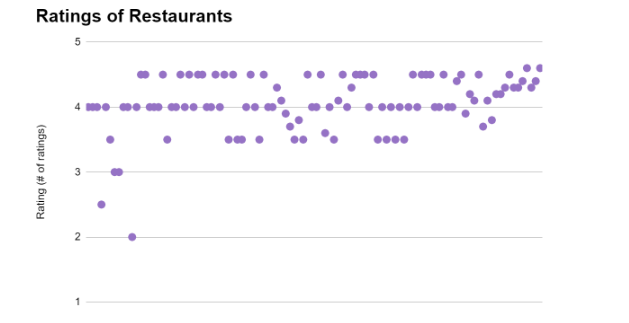 The above figure is a scatter chart, and this displays all of the restaurant cases in our data. All restaurants are rated from 1 to 5 stars on Yelp. What this showcases is that no restaurant received either a 1 or 5 star, and the majority of the cases fell between 4 and 4.5 stars for their ratings. The independent variable would be the restaurants, and the dependent variable would be the number of ratings as the ratings change and vary based on the restaurant. With both cheap and expensive restaurants, it would seem that common ratings are shared. 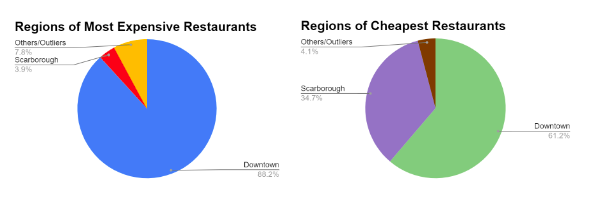 These two pie charts mainly analyzed the geographical location of the restaurant. We created separate charts for the most expensive restaurants and the cheapest restaurants for comparison purposes. In the table of the most expensive restaurants, the majority of restaurants are concentrated in the Downtown area, with very few in Scarborough and other locations. While in the graph of the cheapest restaurants, the distribution of Scarborough restaurants becomes more. In other words, the distribution of cheap restaurants is relatively irregular, and they are more randomly distributed throughout the GTA. This result is in line with our expectation of restaurant location and shows the importance of central place theory for restaurant distribution. Expensive restaurants are located in downtown areas because people are willing to spend more time traveling in central districts and busy places. As the center of the GTA, the population is more concentrated in Downtown, and people are more likely to consider Downtown when considering fine dining, while cheaper restaurants are more likely to be located in various neighborhoods to make it easier for everyone in the community to eat nearby. 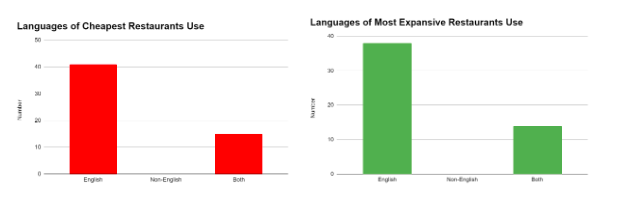 The first graph above shows that a large amount of cheap restaurants use English Language on their menus, while a small amount use both English and Non English language and no restaurant uses a non English language on their menu. The second graph is similar to the first and also shows that a Large amount of expensive restaurants use English Language on their menus, while a small amount use both English and Non English language and no restaurant uses only non English language. Most expensive restaurants use only English in their menus in comparison to the cheaper restaurants who use both English and non English. This shows that there’s a greater cultural representation within the cheaper restaurants in comparison to the expensive restaurants. 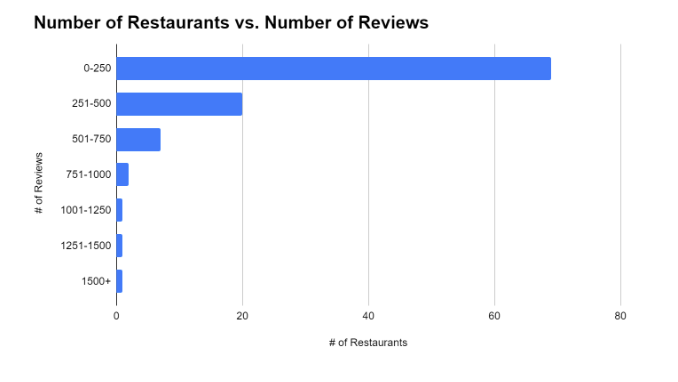 The graph above displays the number of reviews that each restaurant received. To simplify the findings, we used a scale of 250 that ranged from 0 - 1500+. Most restaurants received 0-250 reviews and as the numbers became higher, there were less restaurants listed under that range. A prediction we can make based on these findings is that the lack of reviews for certain restaurants may have turned away potential customers, keeping the restaurants rating low. We can also apply this concept to the restaurants with a high number of reviews because more reviews alongside a good rating, most likely inclined more customers to try these restaurants and leave reviews themselves. Analyzing the number of reviews was a crucial part of our research as the main focus was to assess the location of the most popular restaurants in the GTA. The only way to determine the popularity of the restaurants was to locate customer ratings/reviews found on the internet. Limitations: One limitation of our research is the fact that our data was collected through public opinions which means the results are subjective. This allows room for error, and which can cause our findings to lack consistency. Someone may consider quality as deserving of a high rating, wile others may consider quantity or large portion sizes as more deserving of a high rating. Reviews may also be based on opinions about the restaurant’s atmosphere or customer service rather than the taste of the food. We are also unable to identify the date of the reviews, which could mean that they are outdated. The restaurants could have improved in several aspects since the time that the review was written. Another limitation is that the menus of the restaurants may have been categorized as cheap or expensive based on only a few dishes on the menu. The cost of food and resources are also rapidly fluctuating in Toronto, which could affect the price of certain dishes. Visitors from other parts of the world may not be familiar with the average cost of certain food and resources which may lead them to leave negative reviews based on price. Lastly, our sample size can be considered a limitation because many members of the population in Toronto do not leave reviews on the internet. We are only using the opinions of a small number of people to prove our hypothesis, which means it cannot possibly reflect the entire city or be generalizable to other populations. Conclusion: In conclusion, through our group research investigating cheap and expensive restaurants in the GTA, we were able to find out why restaurants cluster in specific locations. Through our hypothesis on location selection and our central place theory, we were able to find a connection to expensive restaurants being located in the downtown core and cheaper restaurants being located near neighborhoods and people. Although our work is limited and can not be generalizable, our data collection gave us a plausible reasoning for the immense clustering of specific restaurants within the city. Our future research would look into similar populations comparable to Toronto, like Vancouver whilst also using more databases besides Yelp for data collection. References: Jung, S. S., Jang, S. S. 2019. To cluster or not to cluster?: Understanding geographic clustering by restaurant segment. International Journal of Hospitality Management, 77, 448-457. Submitted By:
|